Site Sonar works in real time to identify who's on your website now, understand their needs through insights from their journey on your website, and understand you markets better by automatic list building. Through data-driven insights, your marketing is supported to drive more traffic to your website for qualified leads.
Advanced Analytics For Your Sales & Marketing Teams
- Your Sales Team gets fresh leads directly in their inboxes
- Your Marketing Team gets powerful tools to analyze performance
- Executives get reports to simplify data
Site Sonar Features
- Instant Lead Generation
- Enriched Contact Database
- Customized Email Alerts
- Multiple User Access
- Powerful Search
- Visitor Behavior Tracking
- Lead Management
- Easy-to-Use Dashboard
Segmenting Data
Site Sonar has excellent filtering to really dive into different segments of your visitors.
By Date
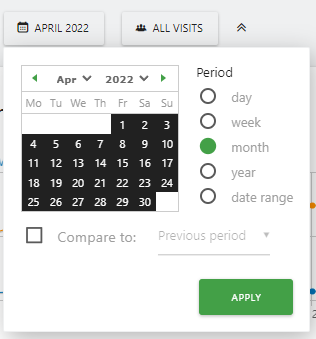
You can segment your visitors by day, week, month, year, or a custom data range as well as compare time frames.
By Segment
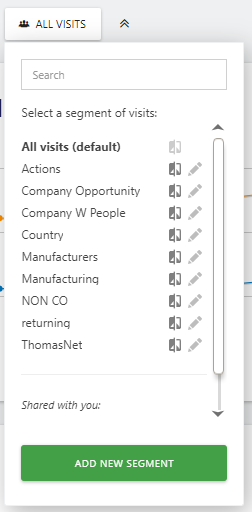
Select any of the default segments or define your own!
Site Sonar for Sales Teams
You can set up Site Sonar to send a lead to anyone on your sales team, but accessing Site Sonar's Visits Log provides an immense amount of data and insights to leverage.
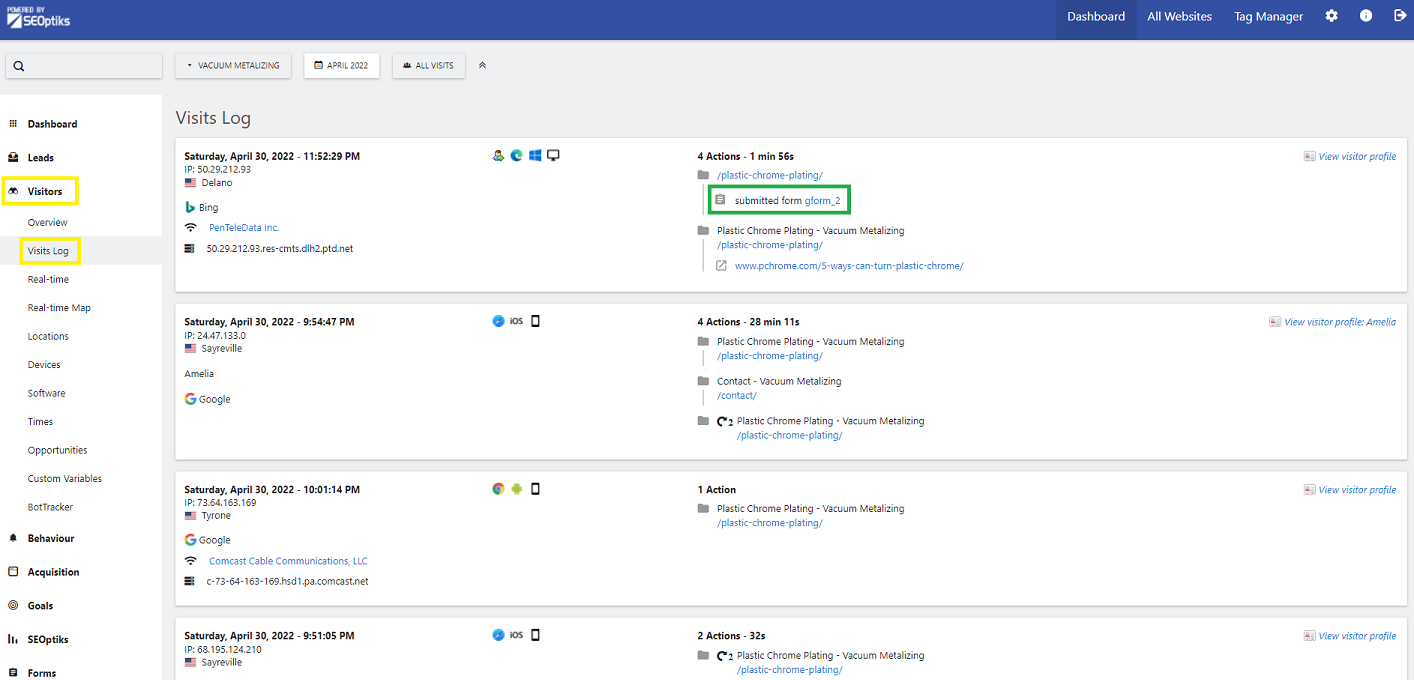
Visits Log
Your Visits Log, under Visitors, provides real-time data on who has been on your website.
- Click Visitors on the left-hand sidebar.
- Click Visits Log
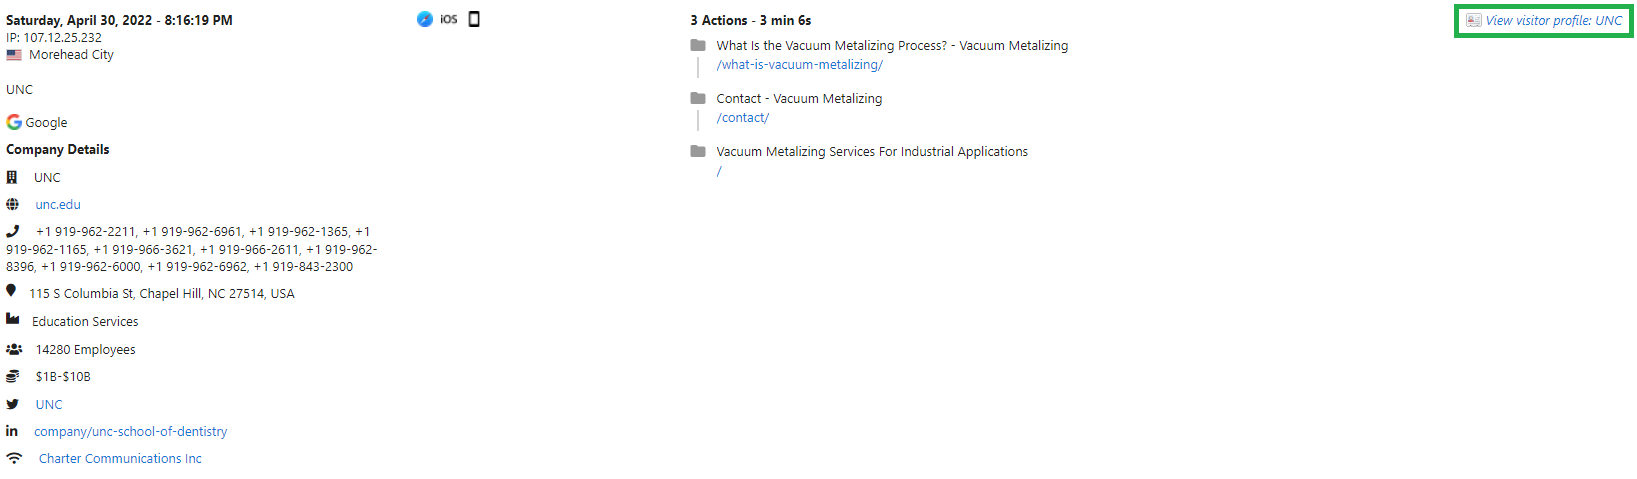
This gives you access to who is on your site and who has visited your site, if they have viewed one or multiple pages on their visit, and who has filled out a form and has become a lead (also, the value of the lead!).
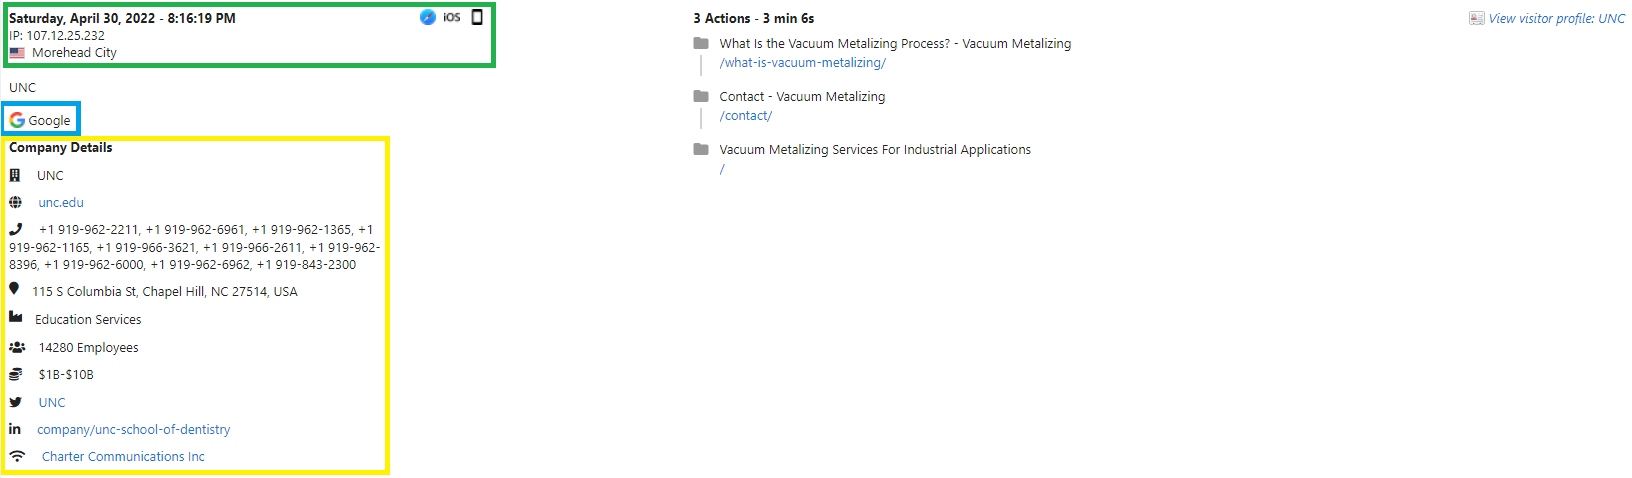
With our powerful software, you can also get insight into their company details such as:
In Green:
- When they visited your website
- Their IP address
- Where they are located during their search
- The browser they used
- If they were on mobile, tablet, or desktop
In Blue:
- What search engine they used for their search
In Yellow:
- What company the visitor is associated with
- The company URL
- Associated phone numbers
- Business address
- Industry or market vertical
- Number of employees
- Annual revenue
- Social media links.
Take a deeper dive into who was on your website by clicking "View Visitor Profile"
This will open a new window to give you additional insights into this individual visitor.
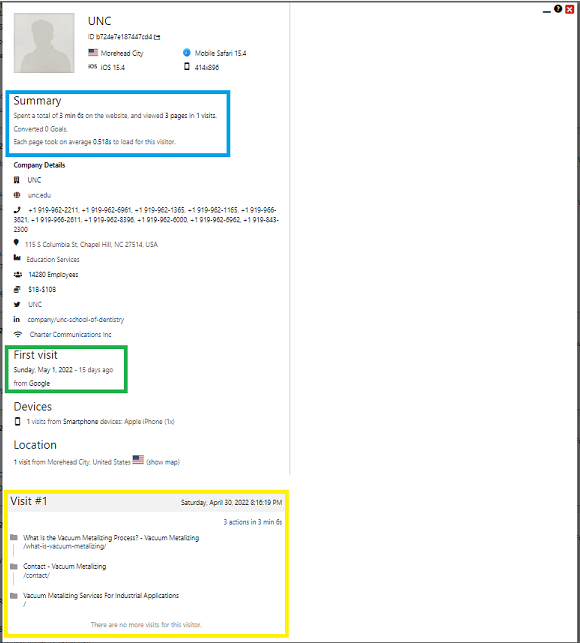
In blue, you see a summary of this visitor.
- Total time spent on the website and how many pages they have viewed
- Number of conversions from this visitor
- How long each page took to load for them
In Green, you see information about their first visit.
- The date of their first visit
- The search engine they found your website through
In yellow, you see each of their visits and the pages they visited.
- What was their entrance page?
- What pages did they visit?
- What was their exit page?
More than one visit? There's data for that!
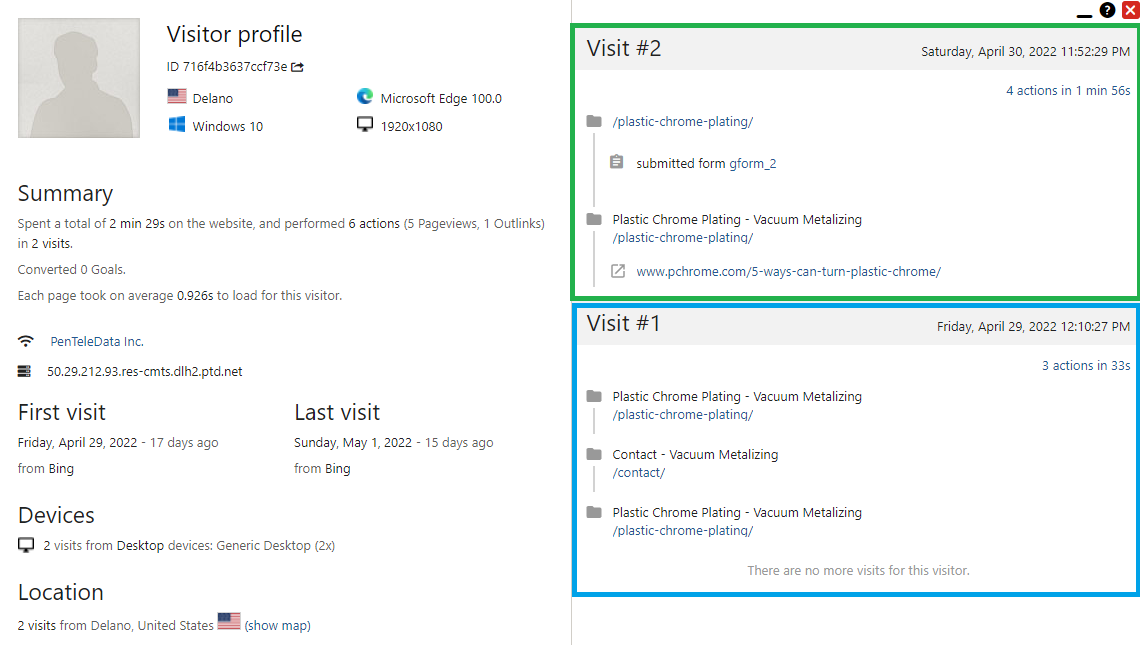
Here we can see that this visitor was one your site twice. On their second visit they filled out a form and became a lead! Based on the pages they visited in this example, they expressed interest in Plastic Chrome Plating on their first visit and came back to fill out a form on the same page.
What if they don't fill out a form? How can my sales team leverage this data?
Based on the above example, if they hadn't filled out a form, your sales person would know this visitor is interested in Plastic Chrome Plating. This is an opportunity to use the contact information provided, or the details to seek out their contact information, to get in touch to see if there's anything you can help them with!
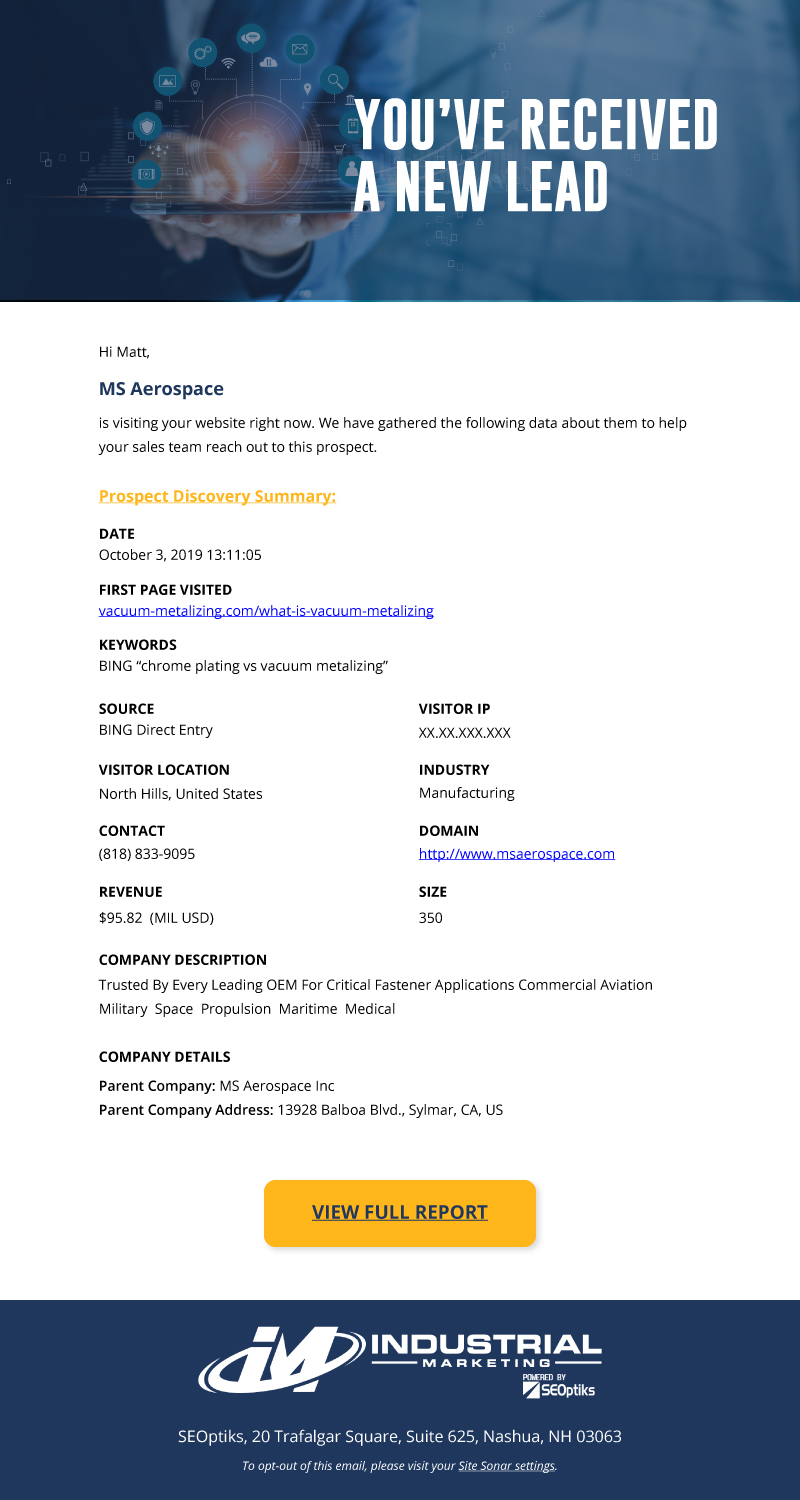
Leads Emailed to Your Sales Team Inbox
Receive each lead in your inbox to tack action!
Our team is available to help set-up integrations and help you set up custom analytics to help your team!
Site Sonar for Marketing Teams
Site Sonar is connected to your Google Analytics and Google Console accounts to pull in rich data all in one place.
Dashboard
You can find several things on your Dashboard (and you can customize it!) to get started. Each one is made to click through to the full insight.
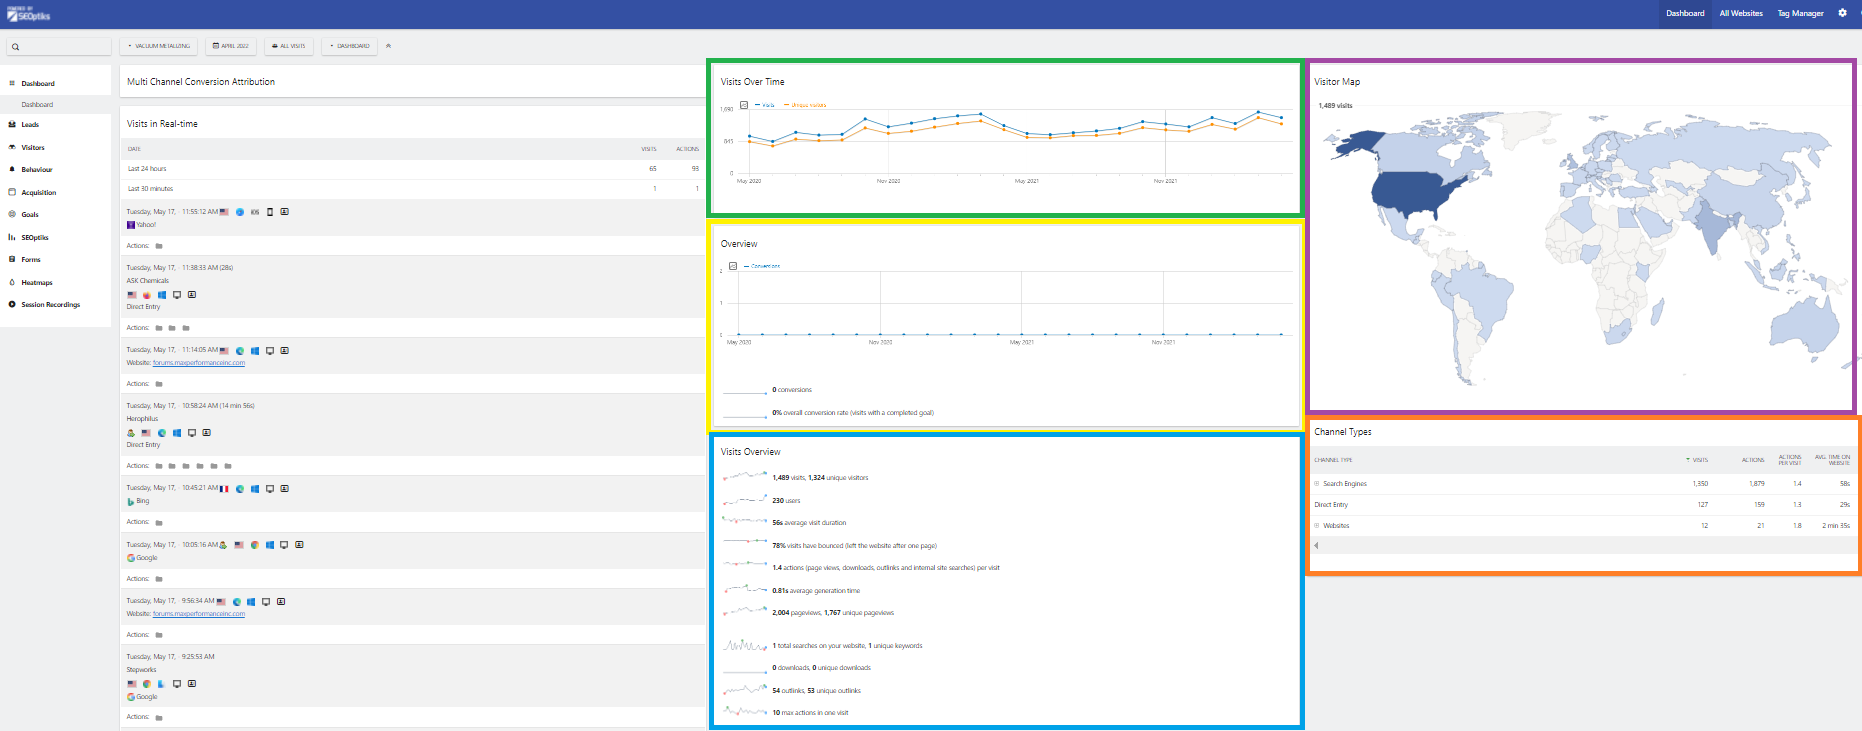
Green - Visits Over Time
Yellow - Conversion Overview
Blue - Visits Overview Stats
Purple - Visitor Map
Orange - Channel Types
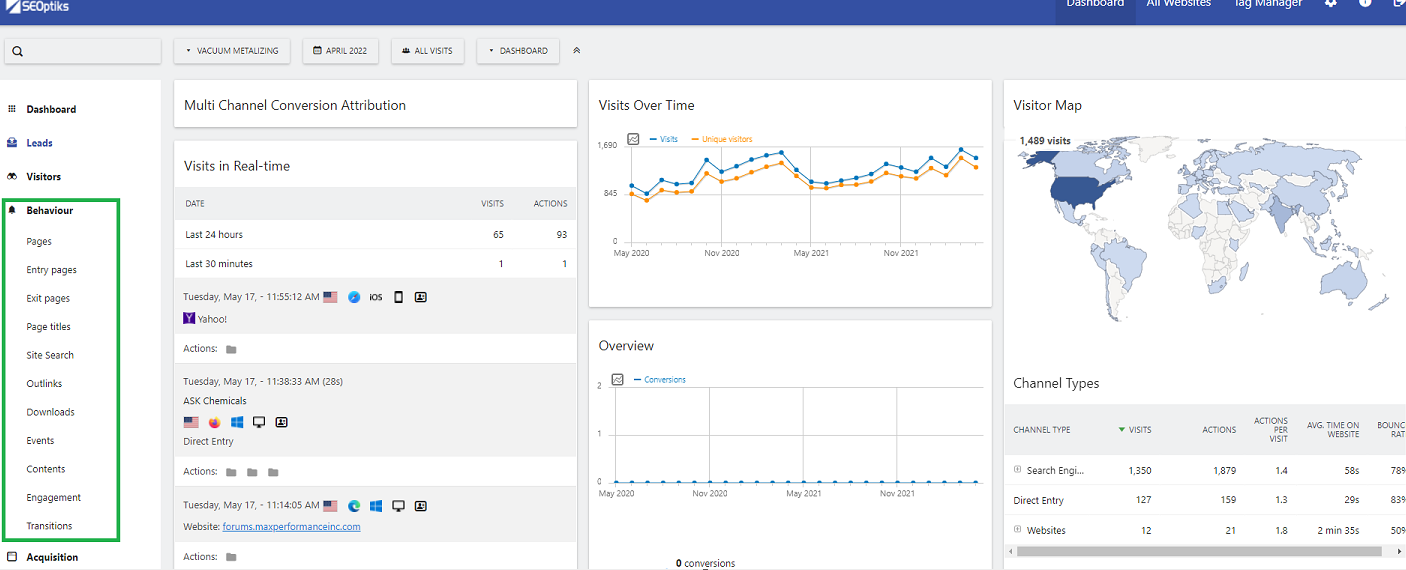
Behavior
Under Behavior you will find analytics for Pages, Entry Pages, Exit Pages, Page Titles, Site Search, Outlinks, Downloads, Events, Contents, Engagement, and Transitions.
- Pages - What pages are getting the most Pageviews, Unique Pageviews, Bounce Rate, Average Time on Page, Exit Rate, and Average Generation Time
- Entry Pages - What page are visitors landing on when they enter your site?
- Exit Pages - What page are visitors leaving your site? (Tip: High exit rate? Maybe the page needs some UX or CRO attention.)
- Page Titles - What is the Title Tag on each page with insight into their Pageviews, Unique Pageviews, Bounce Rate, Average Time on Page, Exit Rate, and Average Generation Time
- Site Search - If your site has a search function, what are people searching for? (Tip: You might need a page for popular searches or the addition of search phrases in existing content!)
- Outlinks - Is your website linking to other websites?
- Downloads - What is being downloaded on your site?
- Events - If you are tracking Events on your site, what actions are visitors taking?
- Content - Are people clicking on or interacting with content on your site?
- Engagement - How are people engaging with your site? This is a dashboard all on it's own!
- Returning Visits Over Time
- Frequency Overview
- Visits per Visit Duration
- Visits per Number of Pages
- Visits by Visit Number
- Visits by Dats Since Last Visit
- Transitions - Learn how visitors move through your site. What did they do before visiting a specific page and what did they do after?
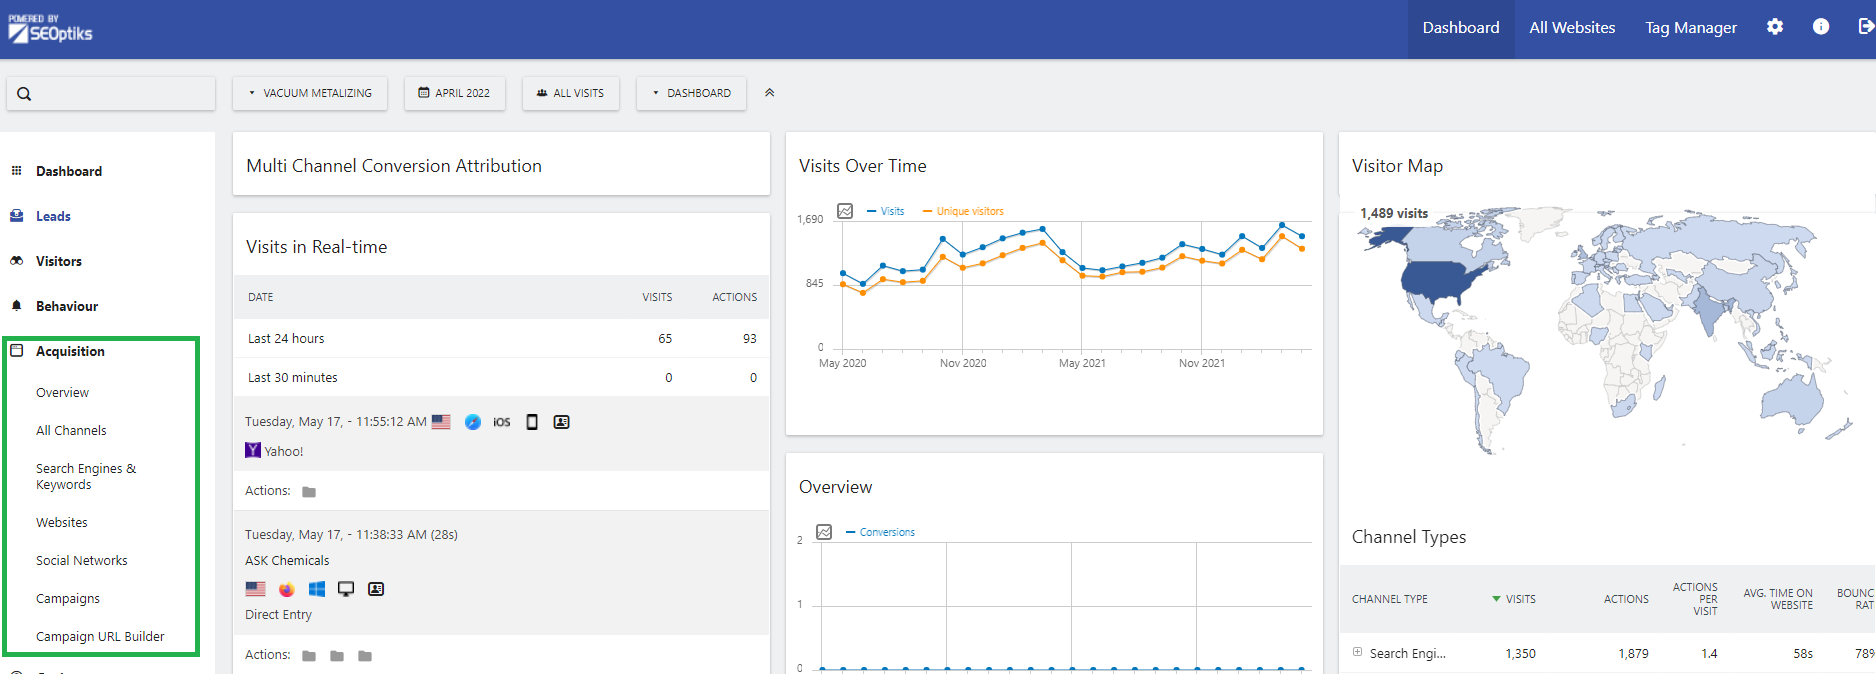
Acquisition
Under Acquisition you will find an overview and analytics for All Channels, Search Engines & Keywords, Websites, Social Networks, Campaigns, and a Campaign URL Builder (super helpful!).
- Overview - You will find a Dashboard showing Evolution over the Period and Channel Type data.
- All Channels - How did someone find your website? Through a search engine? Direct Entry? A website? A Campaign? Other? Who were your top referrers?
- Search Engines & Keywords - What keywords were used to find your site? What search engine did they use?
- Websites - These are the websites that referred people to your site.
- Social Networks - What social network referred a visitor to your site?
- Campaigns - If you have campaigns running, did a visitor find your website through one? (Tip: This is where the Campaign URL Builder comes in handy!)
- Campaign URL Builder - Getting a campaign set-up and want to track it in your analytics? Use the handy Campaign URL Builder to create a trackable link.
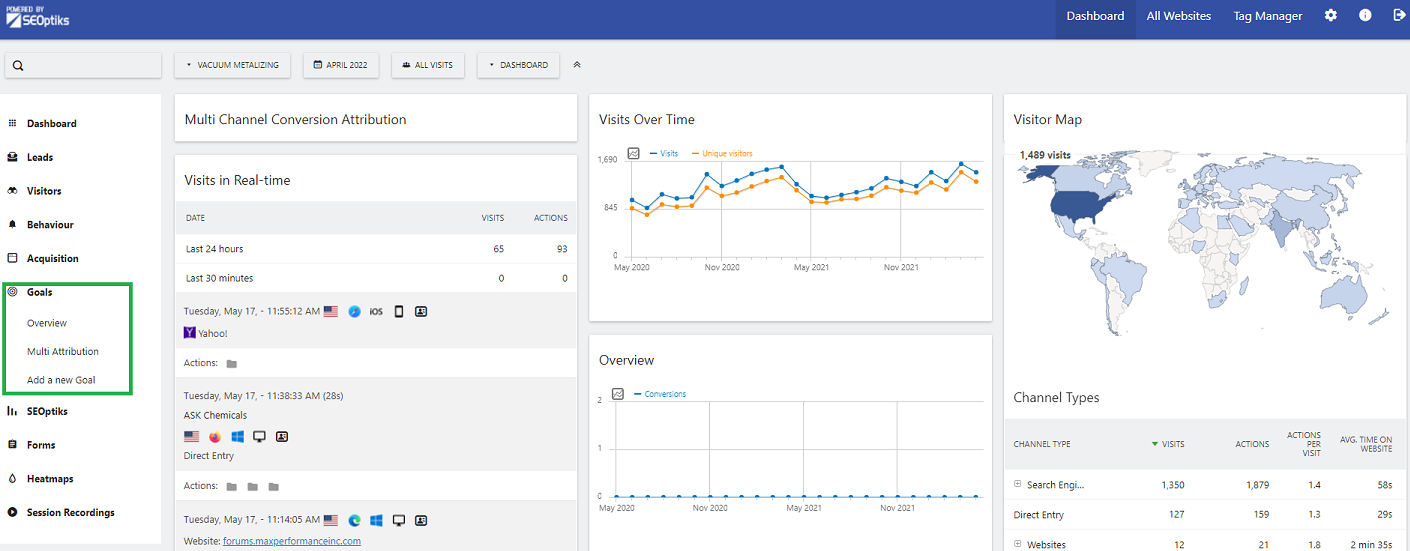
Goals
Under Goals you will find an Overview, Multi Attribution, and Add a New Goal.
- Overview - Goal Evolution over the Period, the total number of conversions for the date range, and % of overall conversion rate (visits with a completed goal).
- Click Evolution over the Period to Manage Goals and add a new goal to track
- Multi Attribution - This lets you assign a value to each visit prior to a conversion for a more accurate view of which channels lead to a conversion.
- Add a New Goal - Easily add new goals to track!
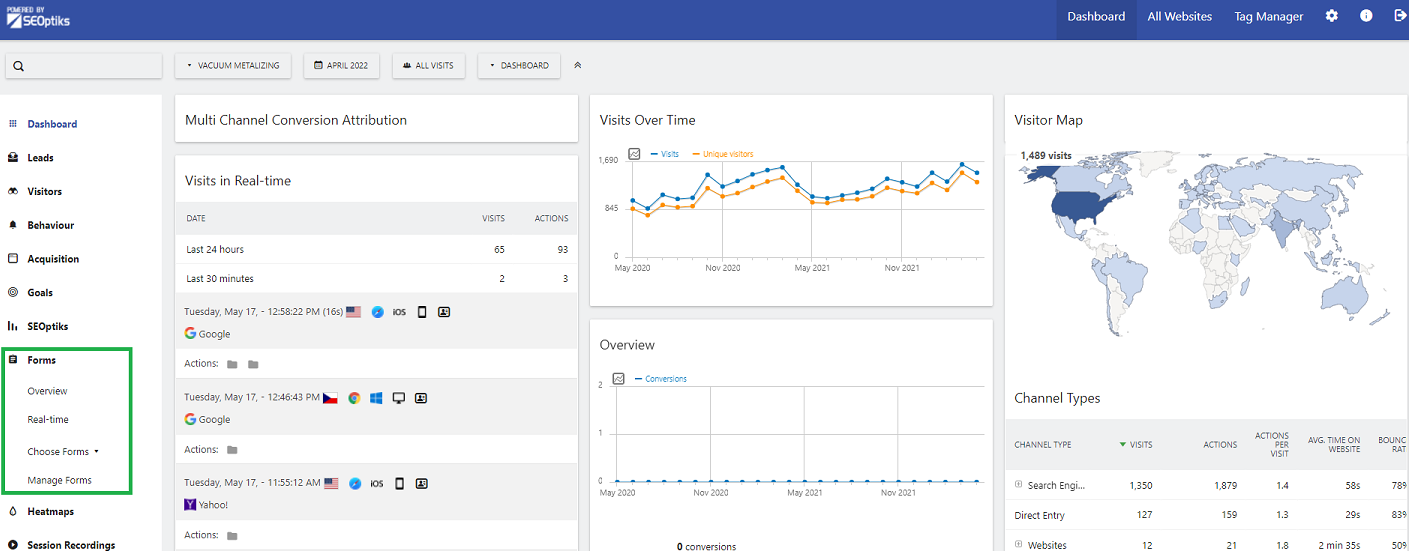
Forms
Under Forms you will find an Overview, Real Time, Choose Form, and Manage Forms.
- Overview - Form Evolution over the Period, Forms Overview, and Forms Timing
- Real Time - This is a dashboard of data!
- Forms Overview last 30 Minutes
- Forms Overview last 24 Hours
- Most Popular Forms Last 30 Minutes
- Most Popular Forms Last 24 Hours
- Choose Forms - This is a dropdown menu to select a specific form to analyze. Learn the following about specific forms:
- Form Information - Description, when data is collected, when the form is considered a conversion, as well as the ability to edit the form, show visitors log of form starters, show form subscribers, and show form converters.
- Evolution over the Period - graphed with Form Starters Rate and Form Conversion Rate
- Forms Overview
- % Starter Rate
- % Conversion Rate
- # Views
- # Starters
- # Re-submitters
- % Submitter Rate
- % Re-submitter Rate
- # Viewers
- # Submitters
- # Conversions
- Forms Timings
- Avg. Hesitation Time in Seconds
- Avg. Time to First Submit in Seconds
- Avg. Time Spent in Seconds
- Avg. Time to Conversion in Seconds
- Page URLS - What page is the form on?
- Fields - The fields to fill out on the form
- Drop Off Fields
- Entry Fields
- Field Timings
- Field Size
- Most Used Fields
- Most Corrected
- Unneeded Fields
Heatmaps
Under Heatmaps you will find access to set-up heatmaps and managing heat maps.
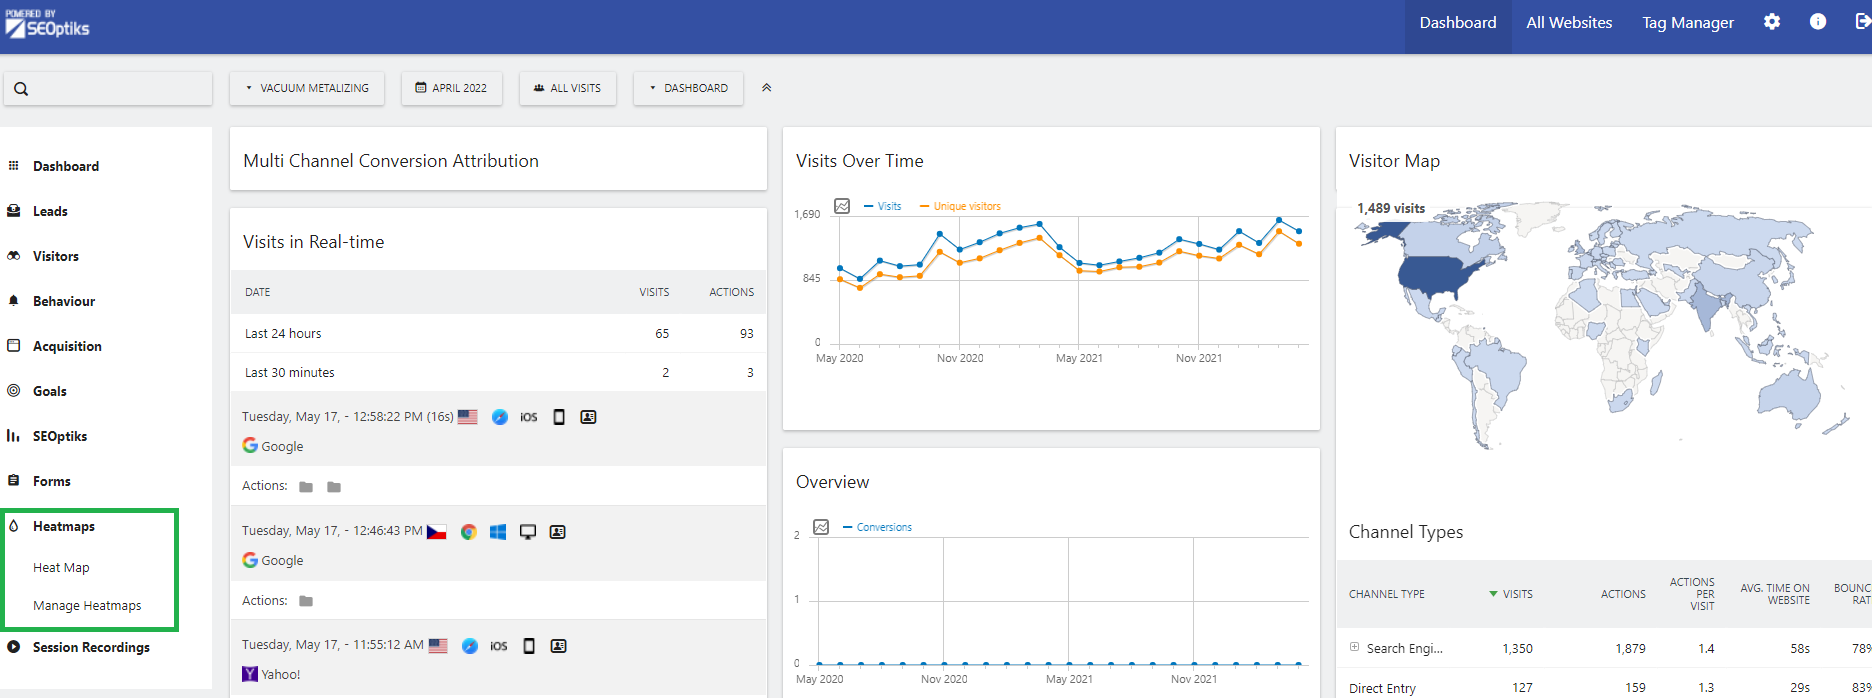
- Heat Map - Once set-up you can see how visitors interact with your site!

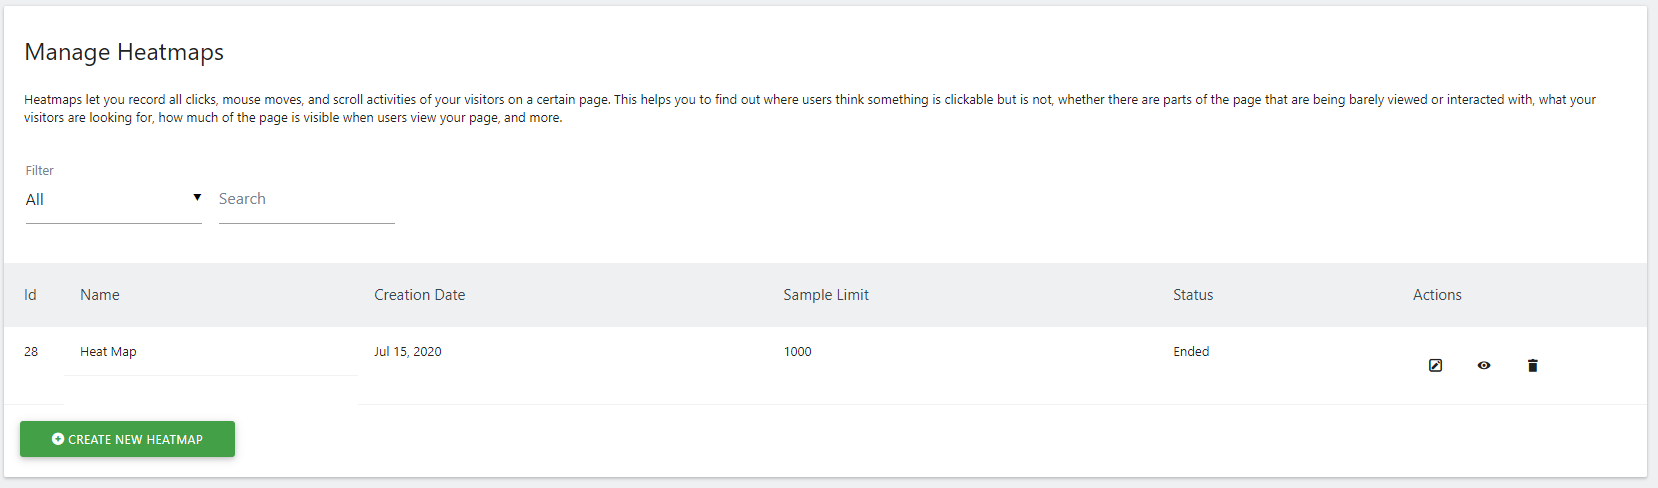
- Manage Heatmaps - See your current and past heatmaps or set up a new one
Our team is available to help set-up integrations and help you set up custom analytics to help your team!
Site Sonar for Executives
Site Sonar can generate daily, weekly, and monthly reports showing you data that you choose.
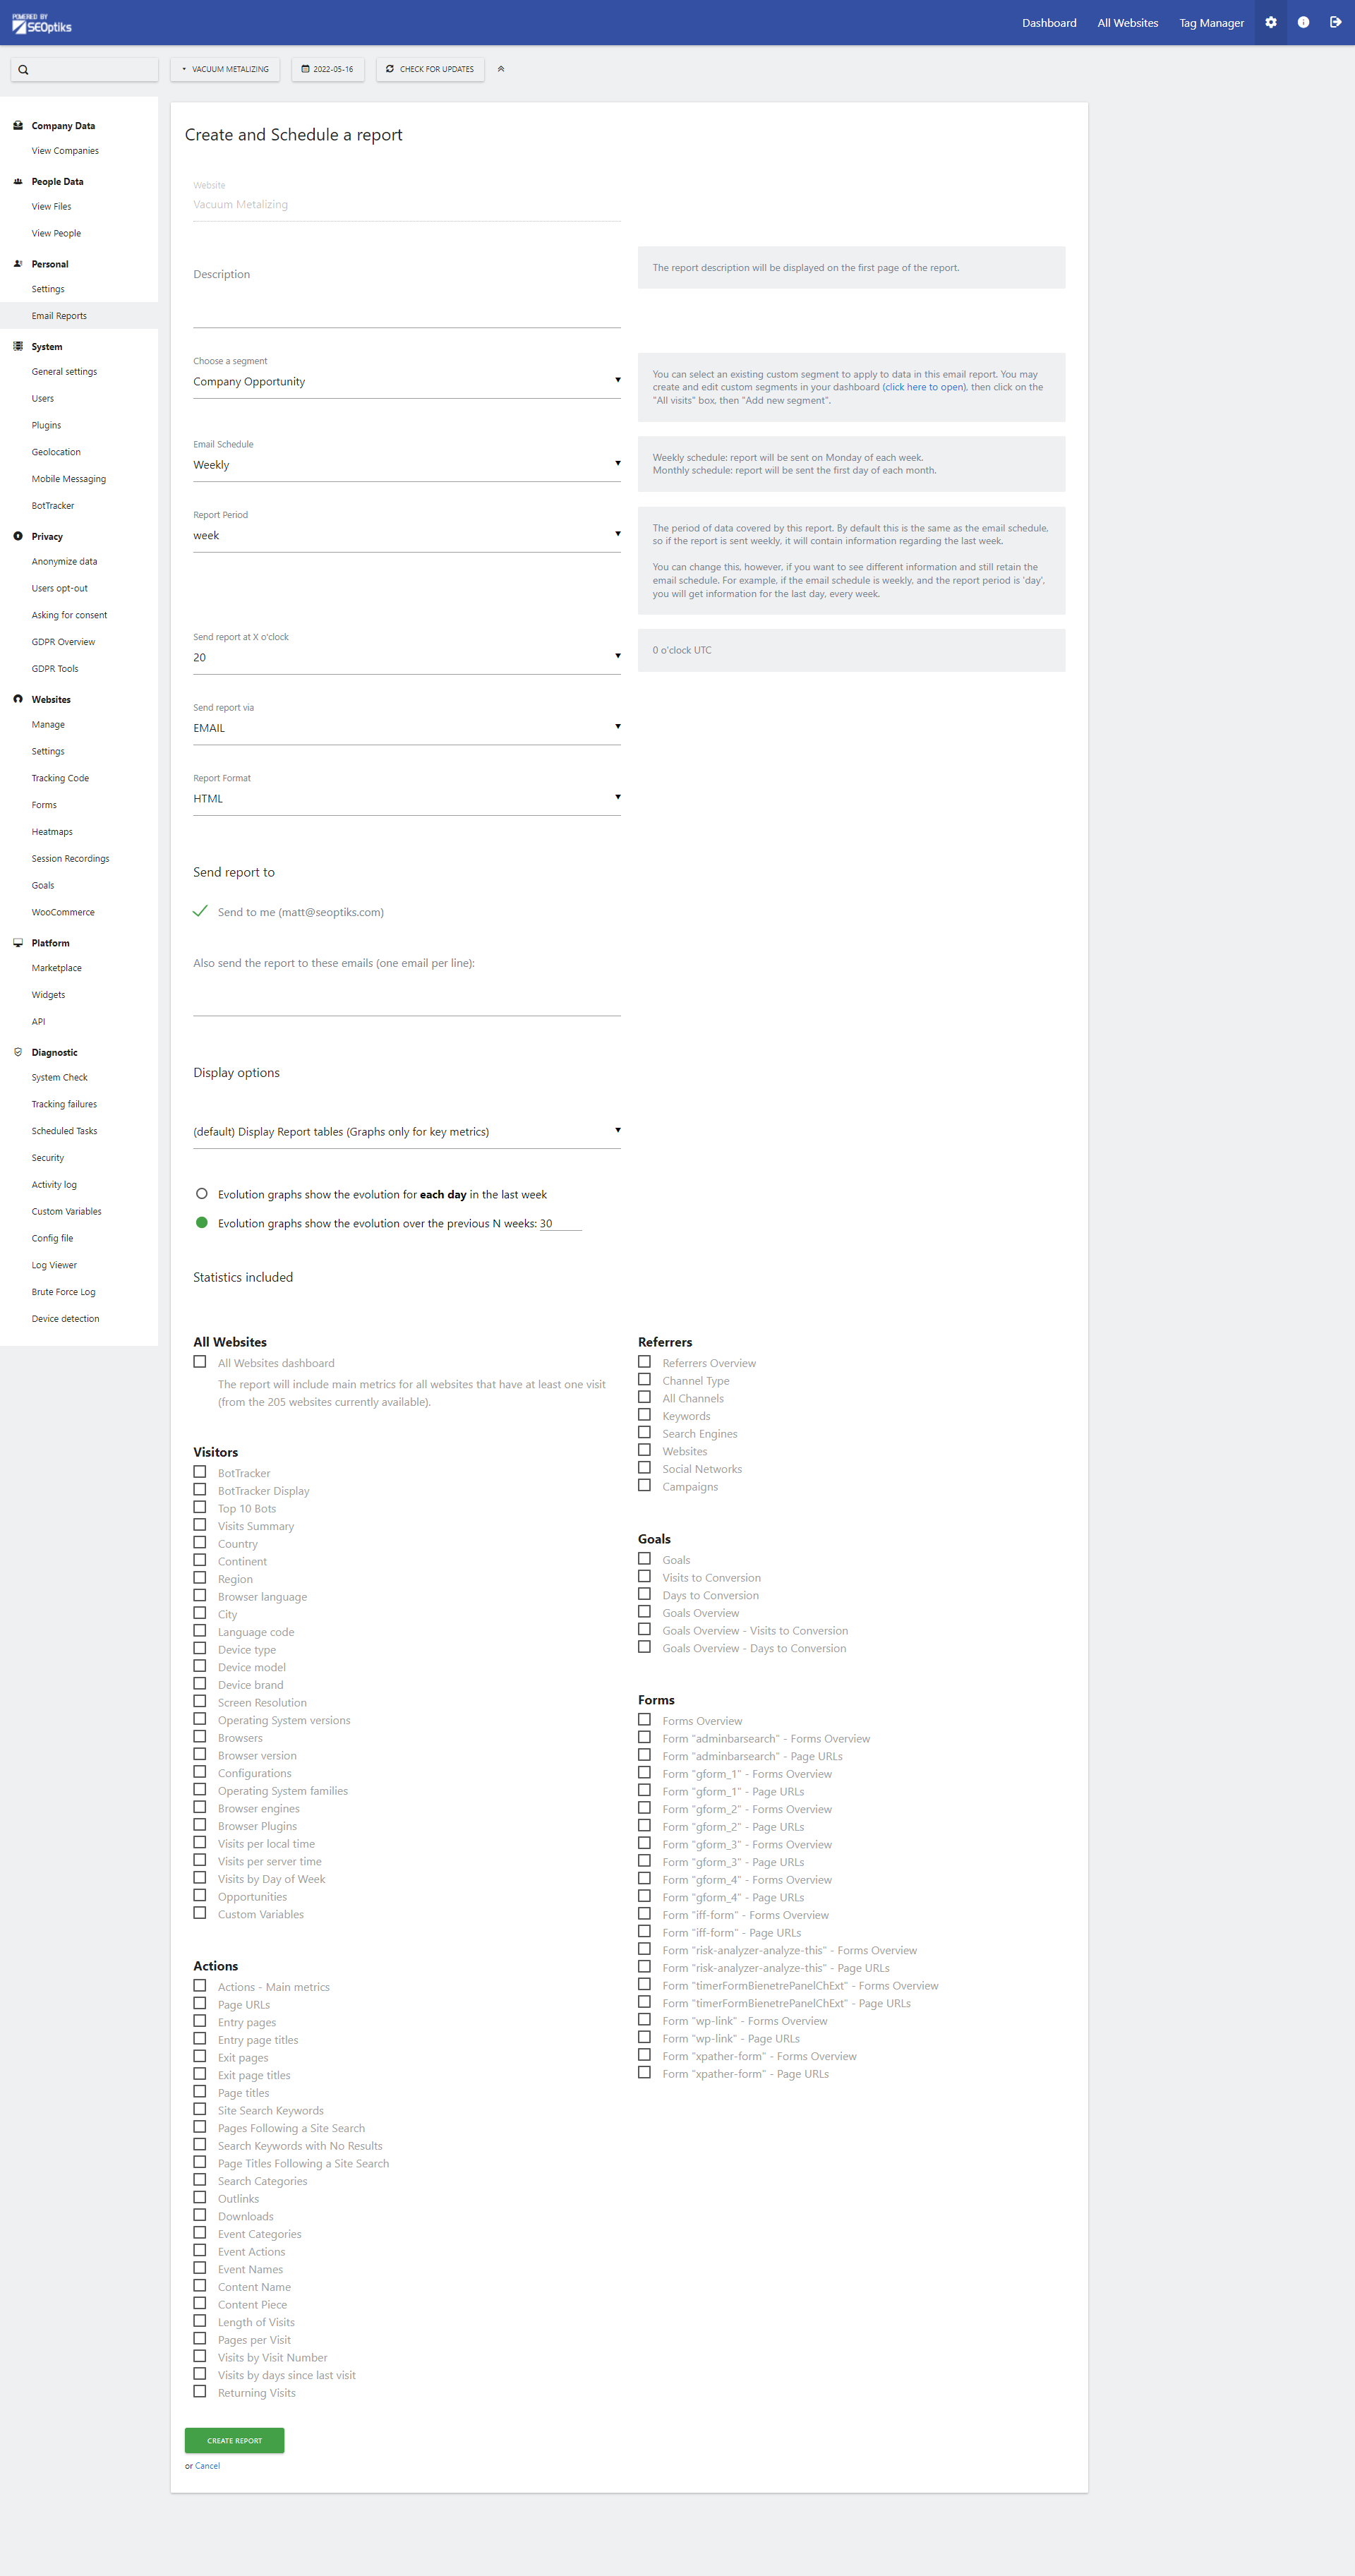
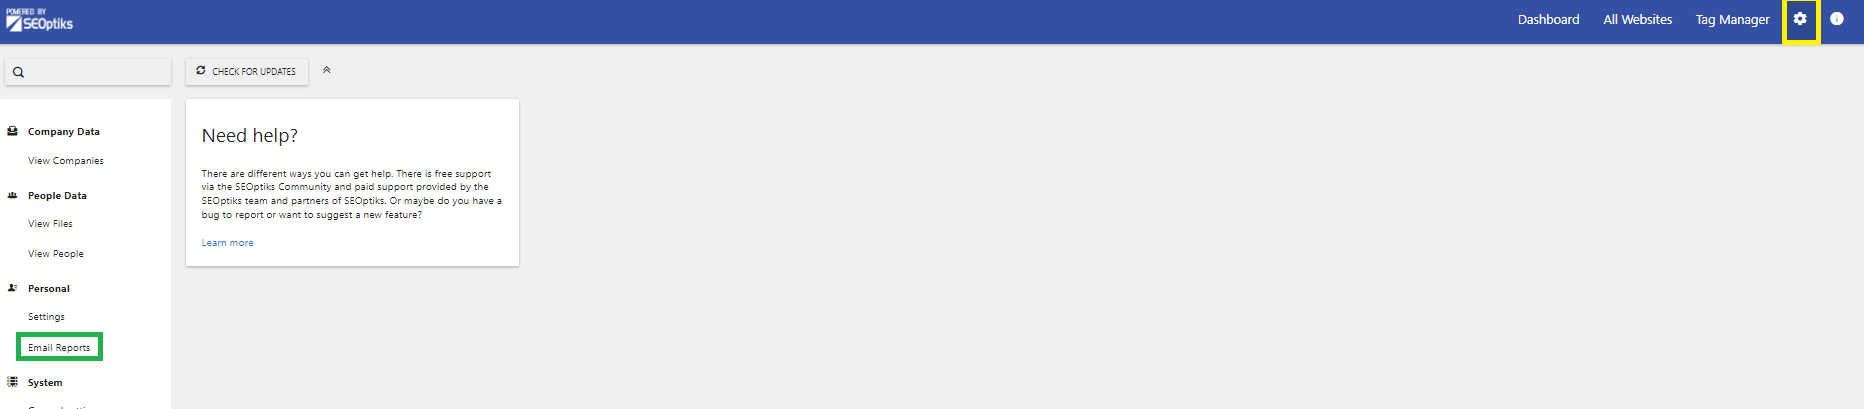
- Start by creating and scheduling a report by clicking the COG in the upper right corner and navigating to Email Reports under Personal.
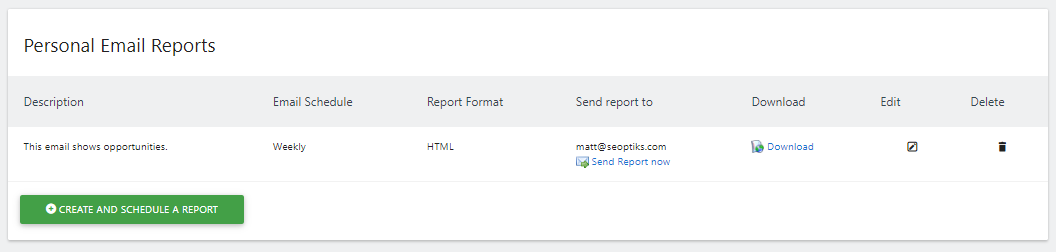
- Click Create and Schedule a Report
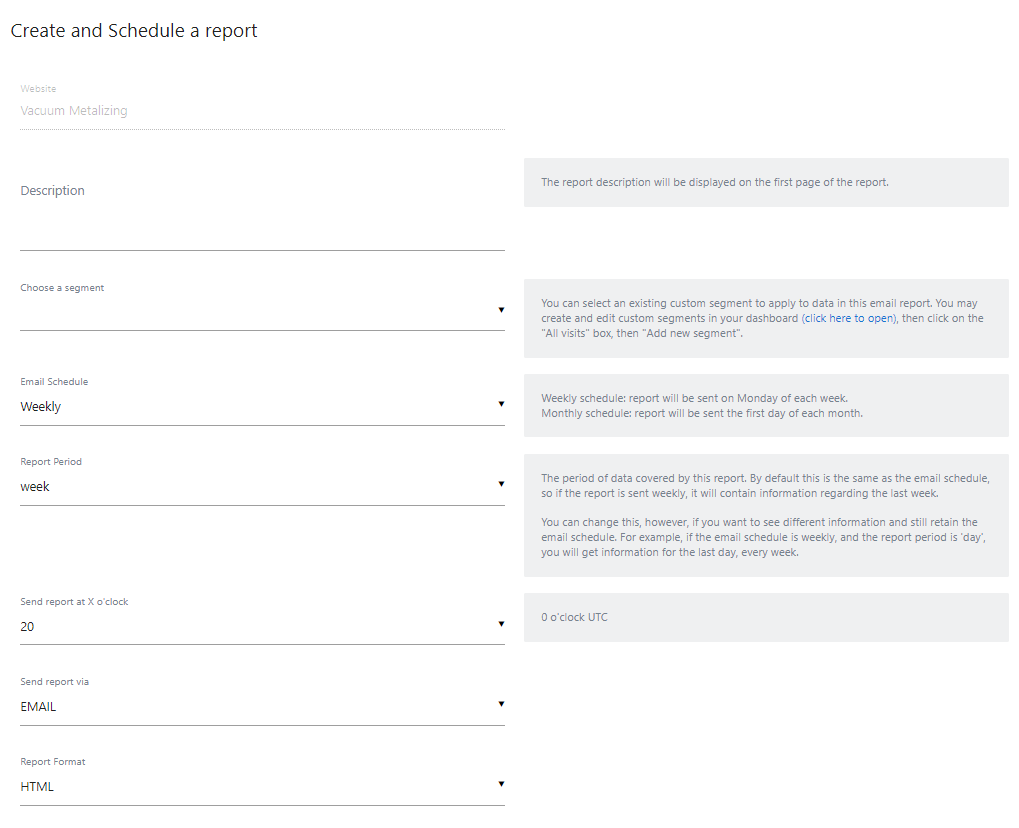
- Add a description, choose a segment, set your schedule, set your report period, set the time to deliver your report, select how you want to receive your report, and the report format
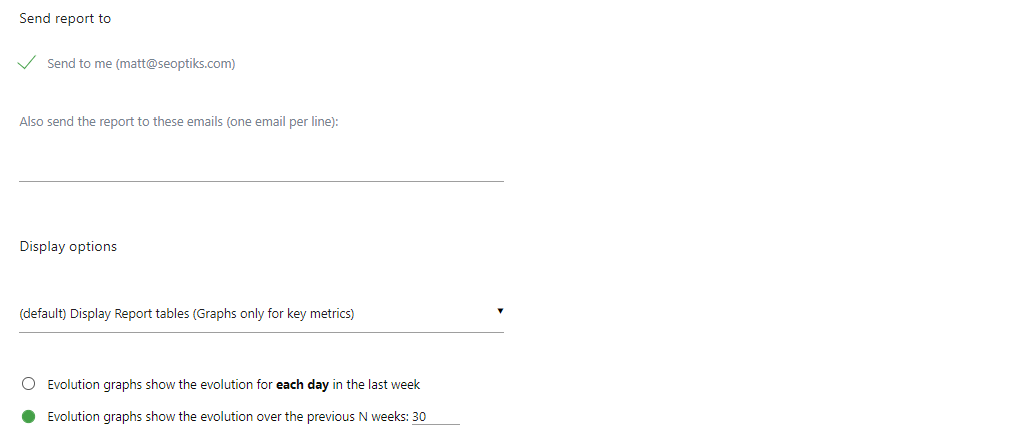
- Next, add any additional emails for anyone you want to receive this report and select your display options.
- Finally, select the statistics you want the report to show. Select options from Visitors, Actions, Referrers, Goals, and Forms. Select as many or as few as you want!
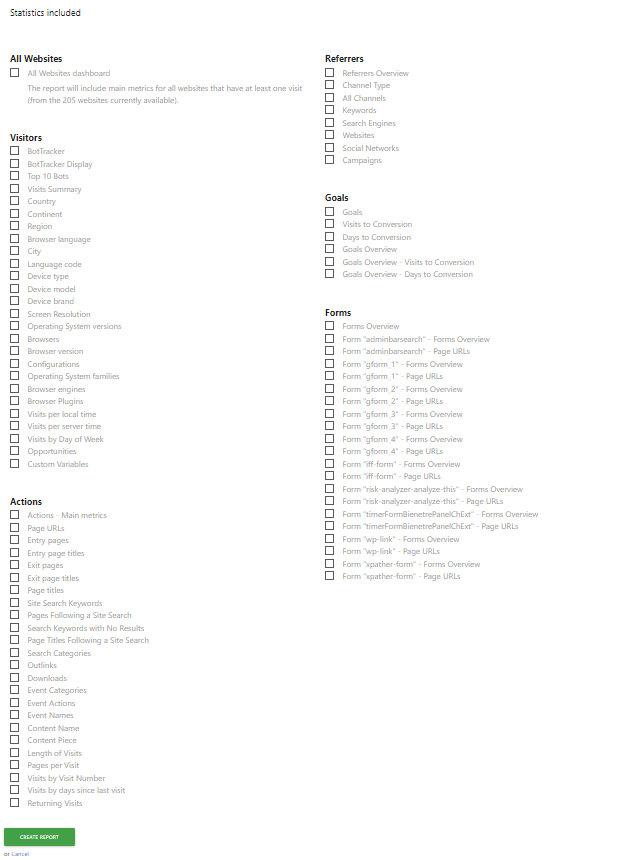
- Click Create Report. All set!
Your Strategy Coach is happy to schedule a call to go over Site Sonar!
![]()