Industrial Marketing's Reporting Dashboard shows all your website's data in one place, including Rankings, Website Traffic, Backlinks, Site Audits, Google Search Console Top Pages and Top Queries, Google Ads Campaigns and Ads, Call Tracking, Citations, and many other integrations you may have!
Within each of these sections, you can deep dive to explore your data to make data-driven marketing decisions.
You will also receive a monthly automated email report for any integrations you may have. This article can help you read that report!
Quick Links
- Rankings Dashboard
- Website Traffic Dashboard
- Backlinks
- Site Auditor
- Google Ads
- Search Console
- Call Tracking
- Citations
- Other Integrations and How to Add Them
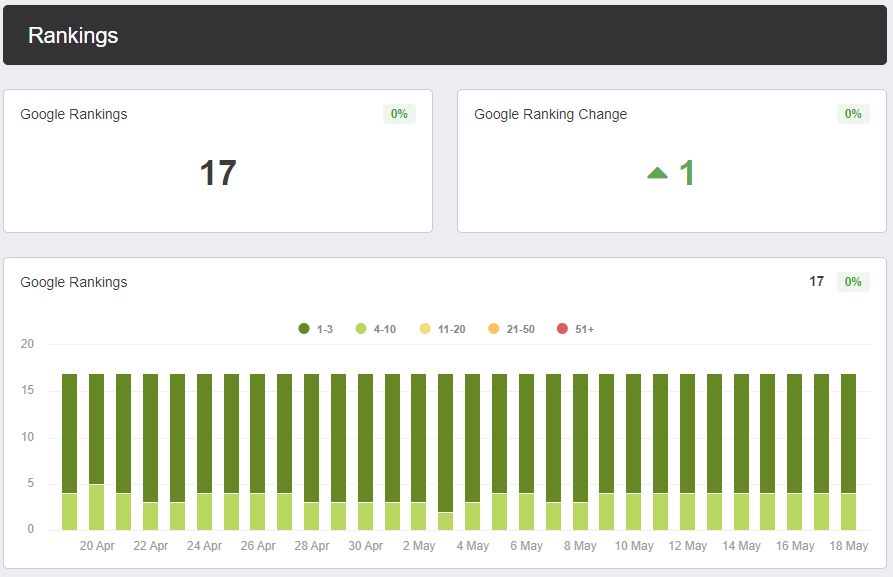
Rankings
On the Dashboard, you can see an overview of your currently tracked keyword rankings.
At a high level you will see:
- Google Rankings - The number of keywords you are tracking
- Google Rank Change - Compares the first day of your date range to the last day of your date range and shows the difference in all your keyword ranks. This can be positive or negative. This is a high-level view of all your keyword ranks.
- Google Rankings - This bar chart shows how many keywords are in positions 1-3, 4-10, 11-20, 21-50, and 50+. The more dark and light green, the better.
Rank Tracker Dashboard
Clicking into the Rank Tracker Dashboard (simply click one of the widgets to open) will give you access to tons of data from Google and Bing.
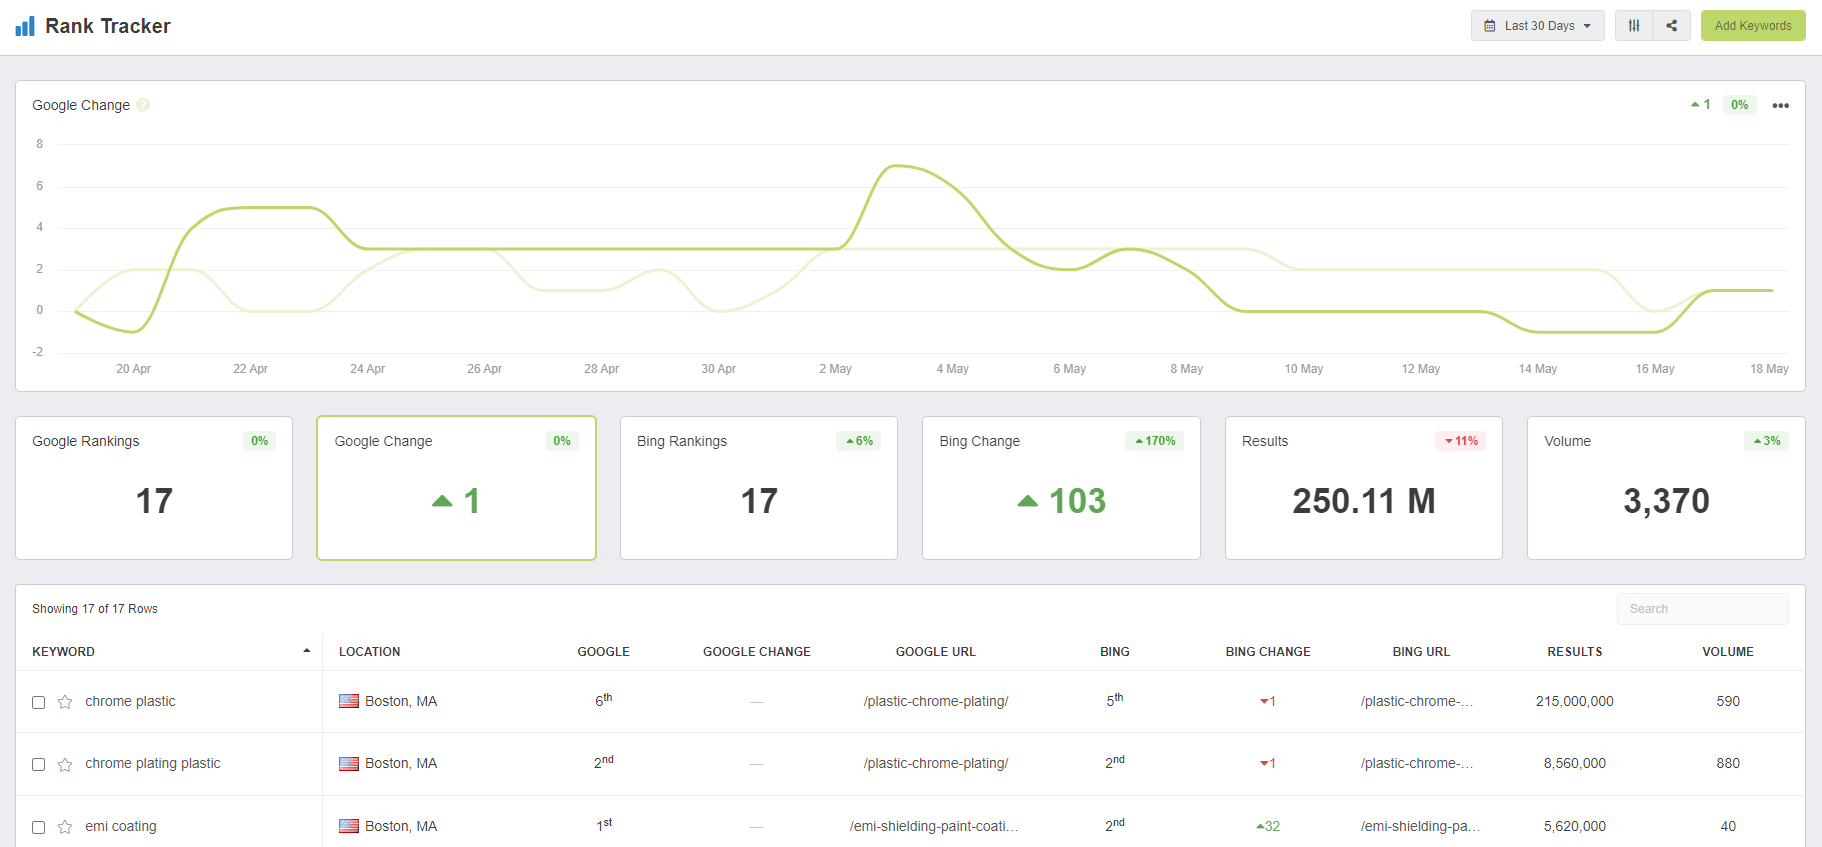
In this view, you will see Google Change, Google and Bing Rankings, Google and Bing Rank Change, Results, Volume, and your tracked keywords.
- Google Change - This line chart plots ranking changes across time comparing the first day of your date range.
- Google and Bing Rankings - The number of keywords being tracked.
- Google and Bing Change - The overall change for all keywords tracked by summing each keyword's individual change.
- Results - The number of pages show in the search engine results page (SERP) for your tracked keywords
- Volume - The sum of the organic search volume for all the keywords being tracked.
- Tracked Keywords - These are the keywords you or our team has added to track the rankings of. This may remain empty until we have enough data to add the best keywords to watch.
Your Strategy Coach is available to answer any questions you might have!
Website Traffic Dashboard
On this Dashboard you will see an overview of the traffic coming into your website with the ability to segment your data by Acquisition, Audience, Conversion, Pages, and Events and further by segmenting by Organic Search, Paid Search, Direct, Social, Referrals, Display, Email, and Other. This data is pulled in from your business Google Analytics account.
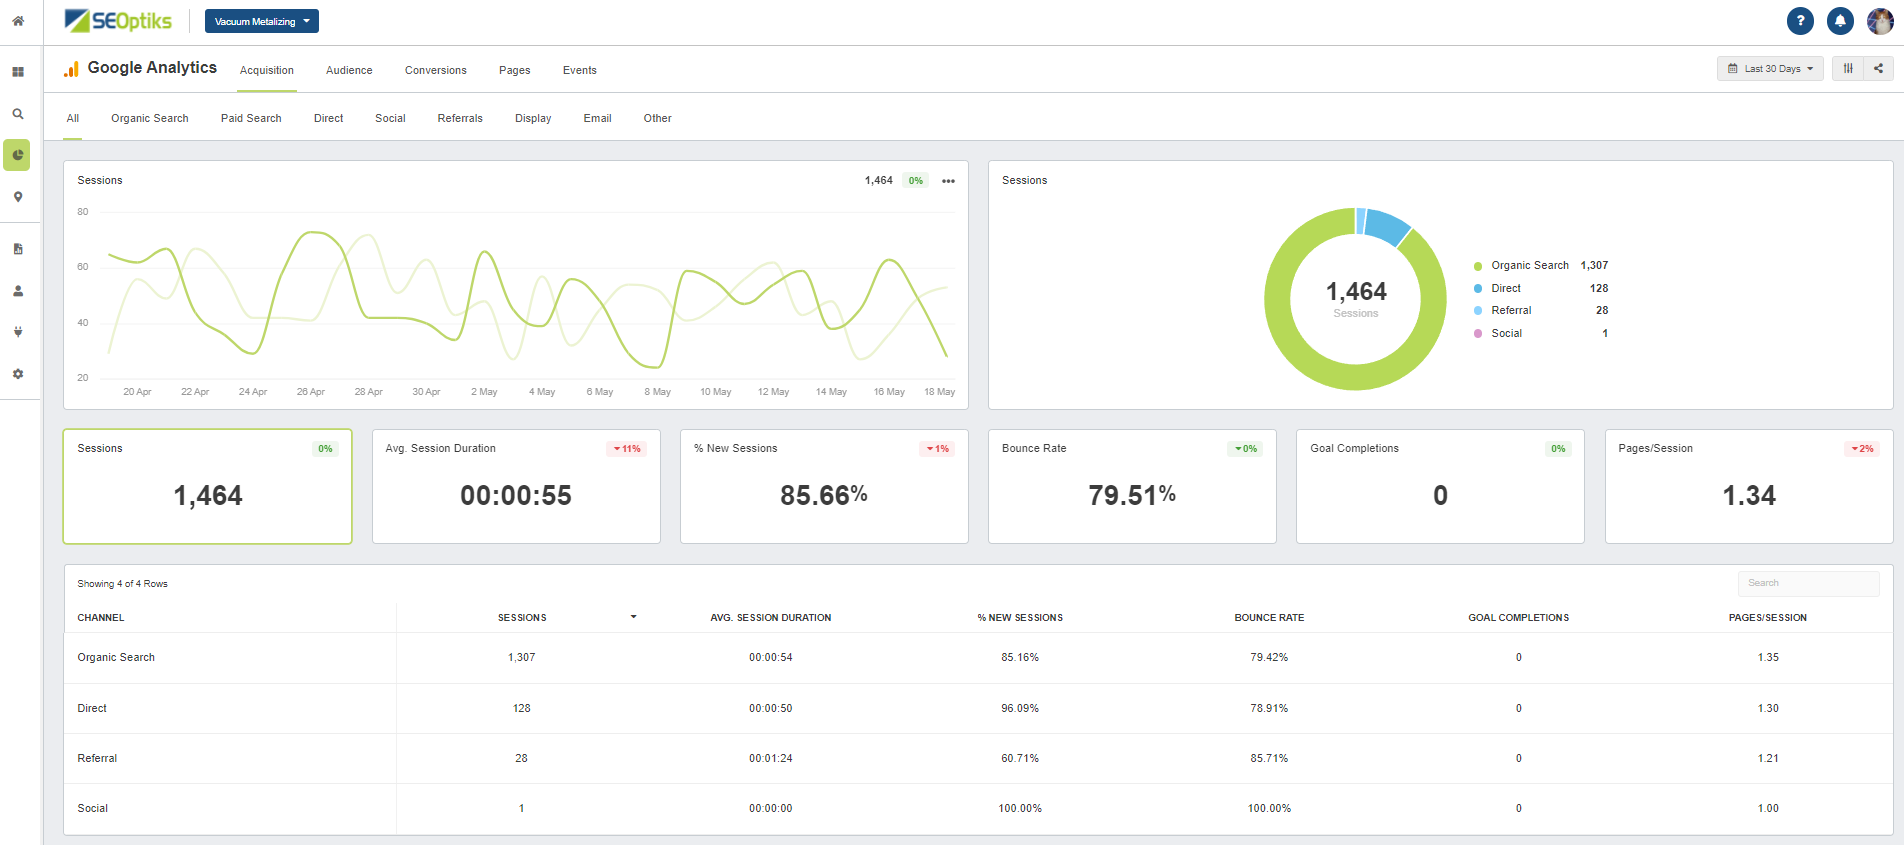
The default view is Acquisition for all searches (above). You will see Sessions as a line chart, a Pie/Donut Graph, and an aggregated number, Average Session Duration, % New Sessions, Bounce Rate, Goal Completions, Pages per Session, and Channels.
Segmenting Data
Clicking any of the segments will give you different views of the data.
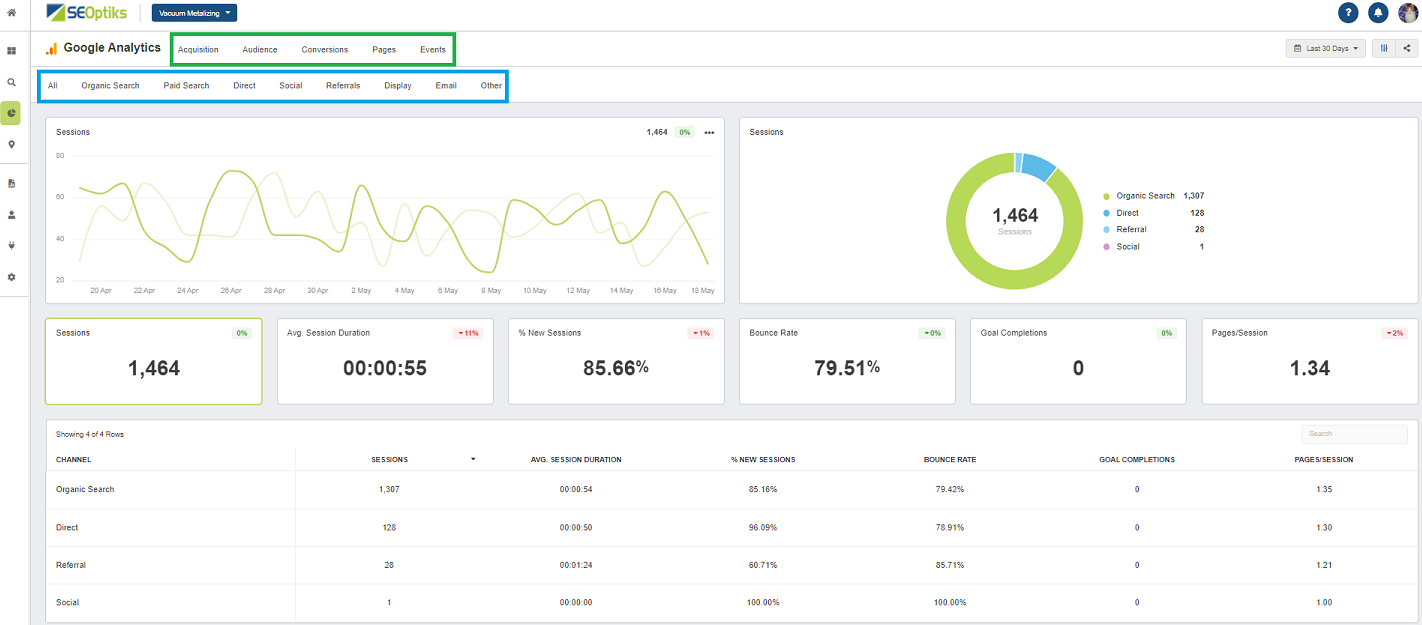
Segments in green (above) will show you traffic data based on:
- Acquisition - how did they arrive on your site
- Audience - visitor demographics
- Conversions - conversion goals set up in Google Analytics
- Pages - what page did they enter and exit your site through
- Events - tracks events set up in Google Analytics
Segmenting with blue (above) will show you different segmentation options based on what you selected in green.
Acquisition
You can segment the channel the visitor arrived through based on:
- Organic Search - they typed a keyword and found you
- Paid Search - visited via a link in a paid campaign
- Social - clicked through a link on social media
- Referrals - clicked a link on someone else's website
- Display - clicked through a display ad
- Email - clicked via a link in an email you sent
- Other - other forms of marketing you are tracking).
Audience
You can segment your audience by
- Location - where are your visitors from?
- Language - What language do they speak?
- Age - What are their ages?
- Gender - What is their gender?
- Devices - What device did they use? Mobile, Tablet, or Desktop?
- Browser - What browser where they using?
- OS - What operating system do they use?
- Interests - What are their general interests?
- New or returning visitors - Are they new or have they visited your site in the past?
Conversions
You can segment conversions based on:
- Goals - Have they met any of the goals set up in Google Analytics?
- Ecommerce - Have you sold any goods on your site?
- Campaigns - Any conversion via a paid campaign?
- Assisted Conversions - For multi-channel funnels, did a channel assist in a conversion?
- Top Conversion Paths - What path did your visitor take to the point they converted.
Pages
Each segment below shows the following metrics: Pageviews, Unique Pageviews, Pages per Session, Average Time on Page, Entrances, and Exits. You can segment pages based on:
- All Pages - This is an overview of all your pages
- Landing Pages - What was the first page a visitor landed on when visiting your site?
- Exit Pages - What page did a visitor leave your site? This is different than bounce rate.
- Content Drilldown - These are engagement metrics for directories and pages on your site.
- Site Speed - How fast is each page on your site? You will see metrics for Average Page Load Time (sec), Average Domain Look Up Time (sec), Page Download Time (ms), Average Page Download Time (sec), Average Server Connection Time (sec), and each page with page specific metrics.
- Site Search - If your site has a search function, what keywords are people using? You will see metrics for Results Pageviews, Total Unique Searches, Session with Search, Search Depth, and Site Search Status.
Events
You can segment events based on:
- Category - This parameter is the name that you use as a way to group objects that you want to analyze.
- Action - You will use the action parameter to name the type of event or interaction you want to measure for a particular web object, for example "video".
- Label - You can provide additional information for events that you want to analyze, such as the names of downloaded assets used in conversions.
Your Strategy Coach can discuss any of these metrics with you!
Backlinks Dashboard
On this Dashboard you will see an summary of your backlink profile, Links, Referring Domains, Anchors, New, and Lost.
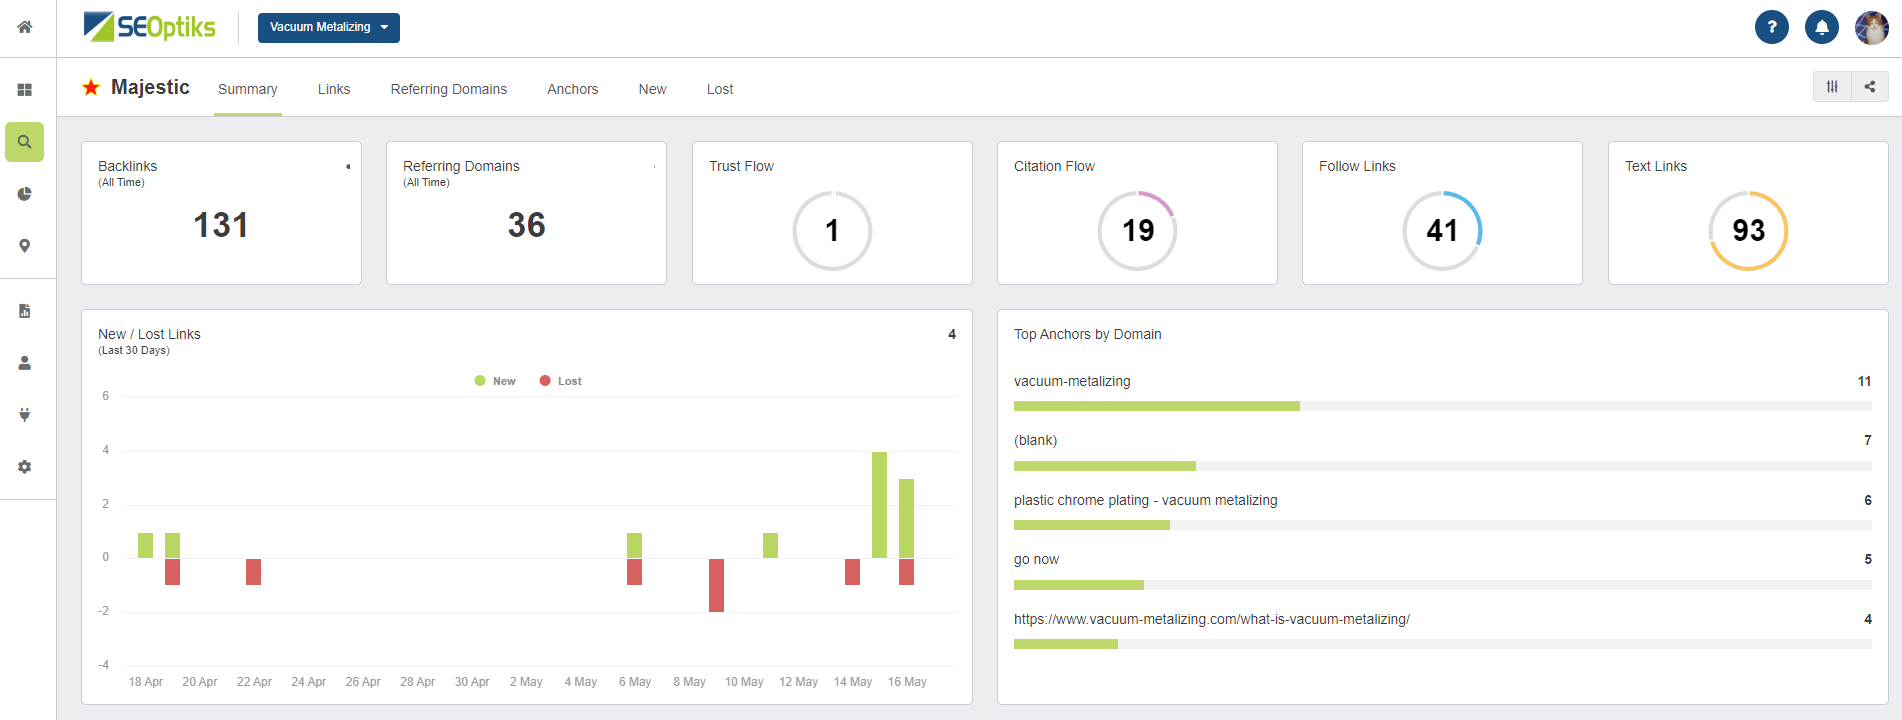
Summary
Here you will see a summary of your Backlinks (all time), Referring Domains, Trust Flow, Citation Flow, Follow Links, Text Links, New and Lost Links, and Top Anchors by Domain.
Links
What URLs contain a link to your website? Here you will see Follow vs No Follow Links, Link Types, Backlinks, and a table of URLs linking to your site.
Referring Domains
How many domains contain a link to your website? Here you will see the number of referring domains, Referring Domains line graph, and a table of domains.
Anchors
What text on the referring domains is associated with your link? Here you will see the Anchor Text, the number of Backlinks the text has, Trust Flow, Citation Flow, No Follow Backlinks, and the number of Referring Domains.
New
What new links have you received? You will see data for the number of New Links, New Links by Date, and a table showing the Date each link was found, the Backlink, the Anchor Text, Trust Flow, and Citation Flow.
Lost
What links have you lost? Find data on the number of Lost Links, Lost Links by Date, and a table showing the Date Lost, Backlink, Anchor Text, Reason Lost, Trust Flow, and Citation Flow.
Your Strategy Coach can discuss any of these metrics with you!
Site Auditor Dashboard
On this Dashboard you will see Tests, Pages, and History of site audits performed on your site.
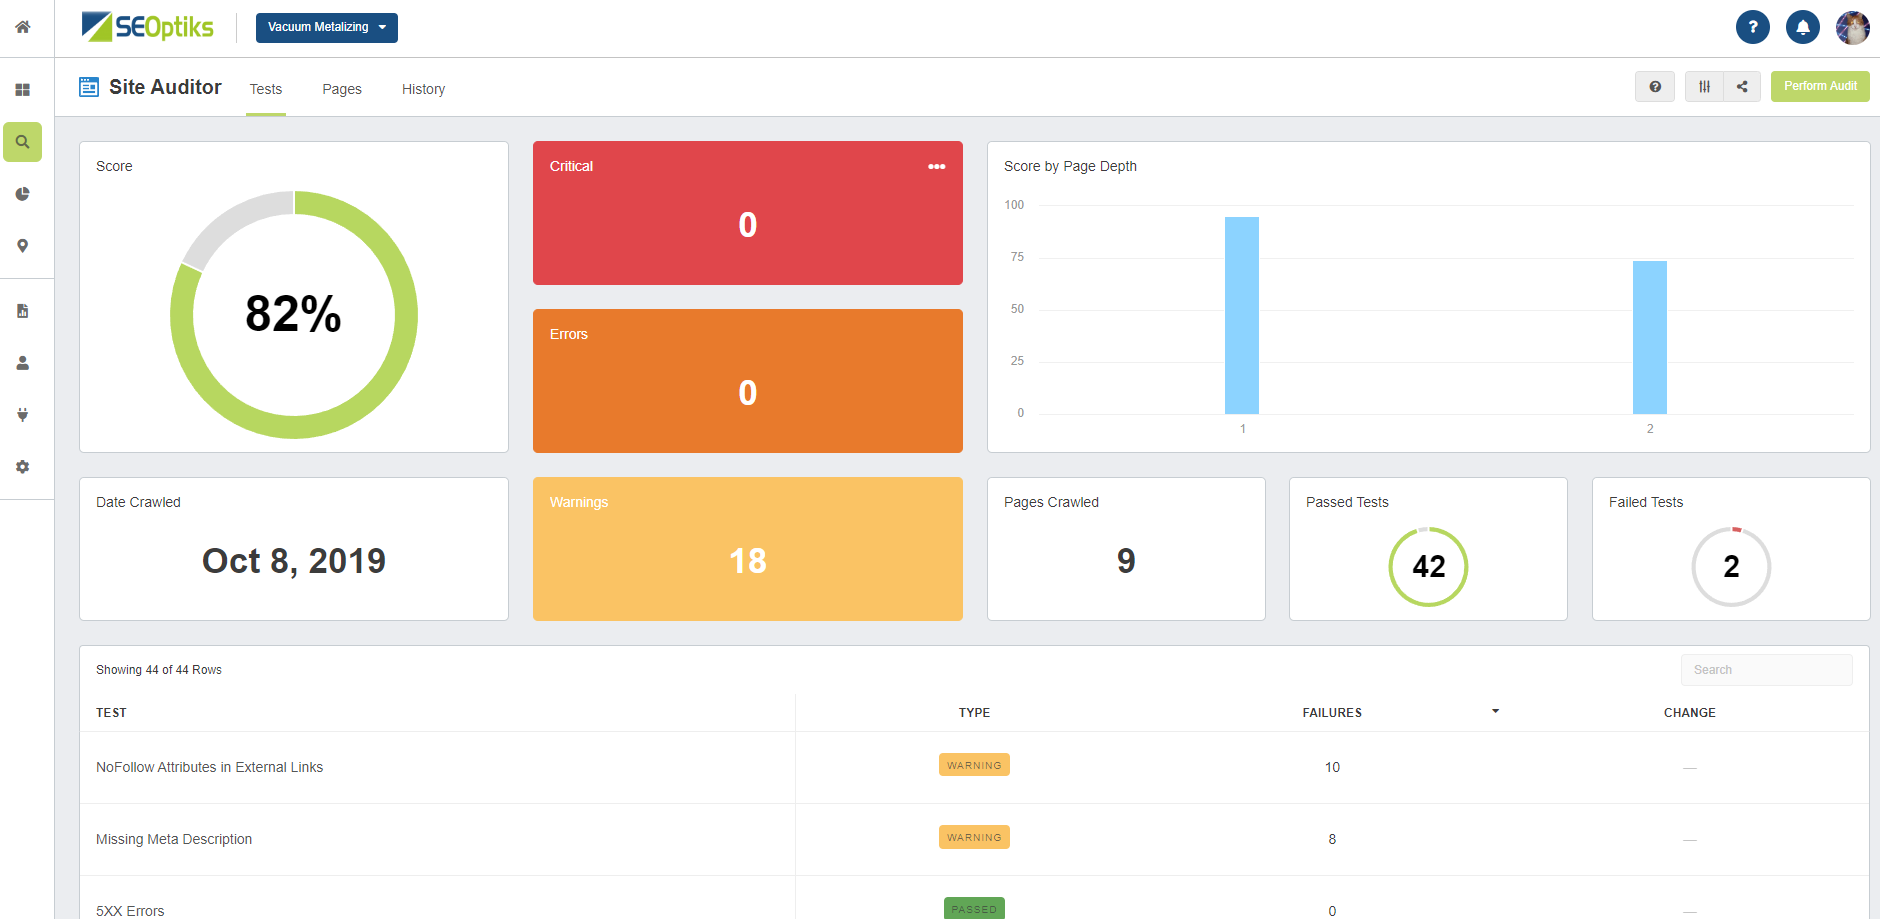
Tests
This dashboard shows the results of site audit tests performed on your website. You will find data for:
- Score - Your site's overall health score
- Date Crawled - When was this audit performed?
- Critical - What results are critical to look into and resolve?
- Errors - What errors are there that need attention?
- Warnings - Are there any warnings to heed?
- Score By Page Depth - Based on how many clicks it takes to get to a page from the homepage, what is their overall score at that depth?
- Pages Crawled - How many pages can Google access for the search engine results page (SERP)? TIP: If you have more pages than the number shown, you may have an indexing problem.
- Passed Tests - How many tests passed?
- Failed Tests - How many tests failed?
- Test - This is a list of tests that were run on your site and shows the type of warning they received, number of failures, and the change.
- Clicking into each test you can go in-depth as to what needs to be fixed.
Pages
This dashboard shows each page's score from the audit. You will find data for:
- Pages by Score - How many pages had a high (good) score? Medium? Low (needs fixing!)
- Pages by Depth - How deep into your link structure are your pages from the homepage?
- Status Codes - What pages are 2xx, 3xx, 5xx,4xx, or other?
- Page - This table shows the page by Title Tag, it's individual score, page depth, in-links, and status code.
History
Look back at your Site Audits to see your site's health progression.
- Score - Each site audit is recorded in a bar graph.
- Pages Crawled - The number of pages crawled on each audit.
- Date - A table showing the audit Date, Audit Duration, Audit Status, Pages Crawled, and Overall Health Score.
Your Strategy Coach can discuss any of these metrics with you!
Google Ads Dashboard
In this dashboard you will see data on your Google Ads campaigns. You will be able to take a deeper look at Campaigns, Ad Groups, Keywords, Shopping, Ads, Conversions, Demographics, Calls, Placements, and Videos.
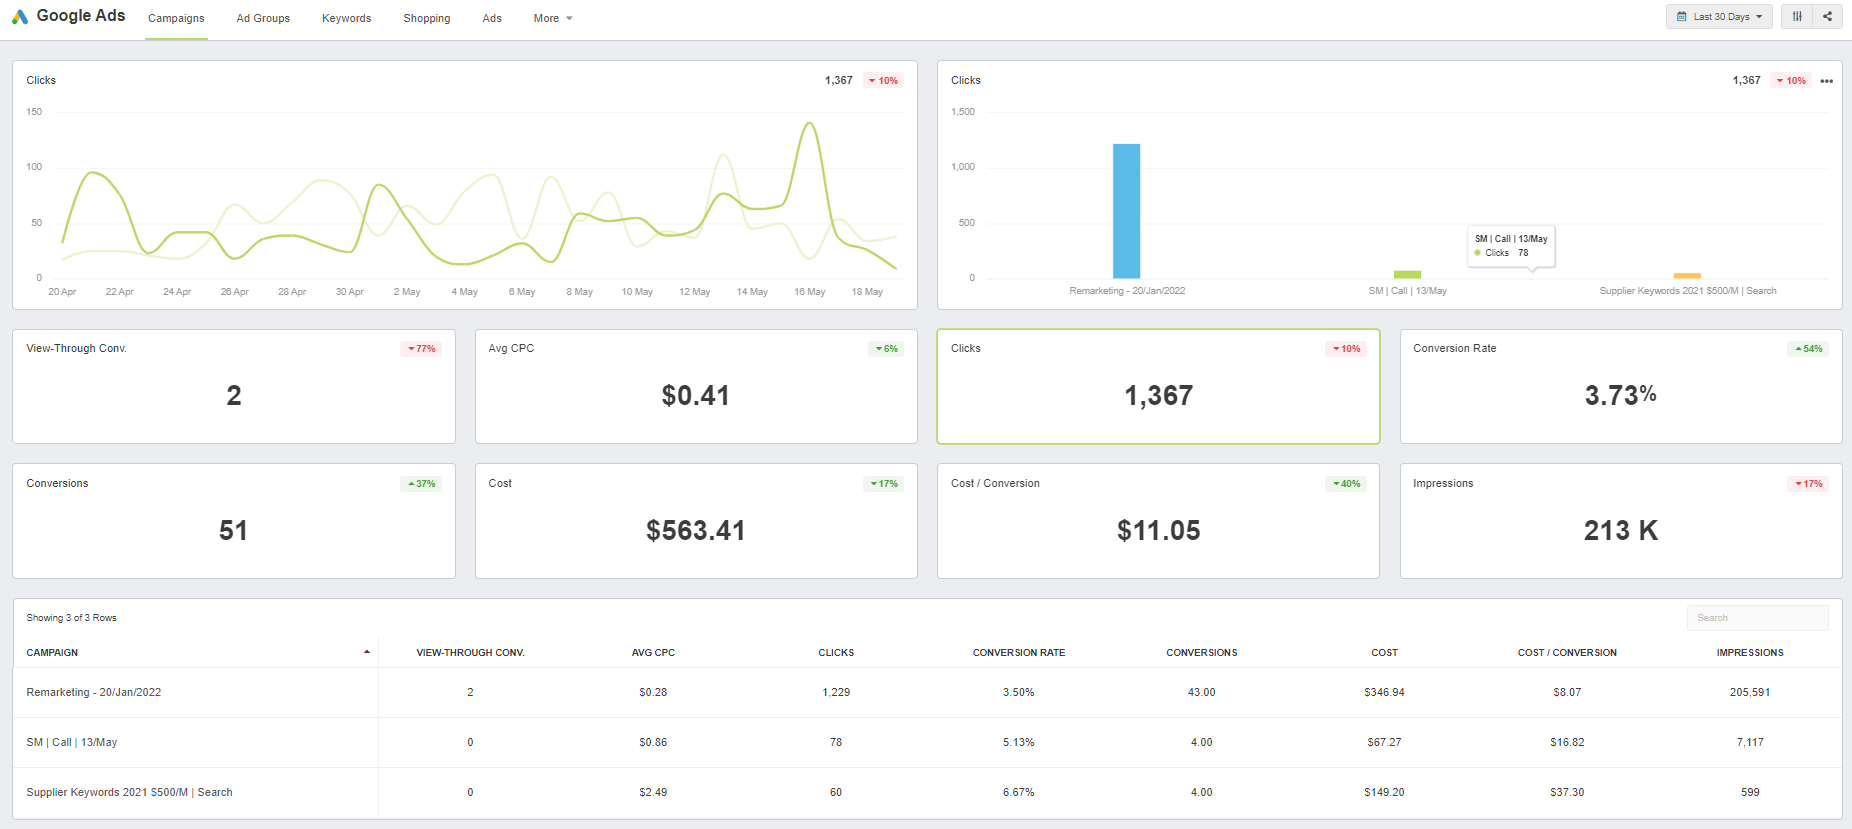
Campaigns
In this view you will see campaign level data based on the selected date range:
- Clicks - How many clicks have you received by day via a line chart, clicks per campaign in a bar graph, and total clicks.
- View Through Conversions - View-through conversions occur after an ad impression, if the user doesn’t interact with the ad, then later converts.
- Average CPC - The average cost-per-click spent
- Conversion Rate (%) - This is the number of conversions divided by the total number of visitors.
- Conversions - The number of conversions completed in the selected date range.
- Cost - Total cost for the selected date range.
- Cost per Conversion - Calculated by taking how much money is spent on an ad campaign, divided by the number of conversions (visitors) over the same period.
- Impressions - The number of times your ad was seen for the selected date range.
- Campaigns - This is a table showing stats for each campaign, including:
- View Through Conversion
- Average CPC
- Clicks
- Conversion Rate
- Conversions
- Cost
- Cost per Conversion
- Impressions
Ad Groups
In this dashboard you will see the same metrics as the Campaign dashboard (above) but at a Ad Group level view. This tells you have each ad group within a campaign is doing.
Keywords
In this dashboard you will see the same metrics as the Campaign and Ad Group dashboards with the addition of the top keywords from the ads.
- Top Keywords - These are the keywords that we are targeting with the ads. Which keywords are performing well?
Shopping
In this dashboard you will see the same metrics as the Campaign and Ad Groups dashboards with the inclusion of your product titles for your Ecommerce shopping site (if applicable).
- Product Title - Products purchased will appear in this table with the following metrics:
- Average CPC
- Clicks
- Conversion Rate
- Conversions
- Cost
- Cost per Conversion
- Impressions
Ads
In this dashboard you will see many of the same metrics of the other dashboards including Top Destination URLs and a table showing each ad and its metrics.
- Top Destination URLs - What are the top URLs being visited from your active ads?
- Ad (table) - This table lists each of the current active ads with the following metrics:
- View-Through Conversions
- Average CPC
- Clicks
- Conversion Rate (%)
- Conversions
- Cost
- Cost per Conversion
- Impressions
Conversions
This dashboard is located under the dropdown "More" and shows Conversions as a line chart, bar graph, and total, View-Through Conversions, and a table of the Conversion Goals.
- Conversions (line chart) - Conversions by day in the selected date range.
- Conversions (bar graph) - The number of conversions per goal.
- Conversions (total) - The total number of conversions across all goals.
- View-Through Conversions - View-through conversions occur after an ad impression, if the user doesn’t interact with the ad, then later converts.
- Conversion Name (table) - This table shows each goal and the number of conversion and View-Through Conversions for each.
Demographics
This dashboard is located under the dropdown "More" and shows Demographics with the same metrics as many previous dashboards with the inclusion of a table of demographics by age.
- Age (table) - This table breaks ages into 18-24, 25-34, 35-44, 45-54, 55-64, 65+, and undefined with the following metrics for each age group:
- View-Through Conversions
- Average CPC
- Clicks
- Conversion Rate
- Conversions
- Cost
- Cost per Conversion
- Impressions
Calls
This dashboard is located under the dropdown "More" and shows Calls being tracked in your ad campaigns for the selected date range. The metrics you see in this dashboard are:
- Calls (line chart) - Calls received plotted by date
- Top Call Types - Calls are tagged with the type of call received, for example manual or mobile search.
- Calls (total) - The total number of calls received in the selected date range.
- Missed - The total number of calls missed (aka not answered).
- Received - The total number of calls received.
- Unknown - The total number of calls from unknown numbers.
- Date (table) - This table shows detailed metrics for each call received in the selected date range for each individual call.
- Date - The date of each call received.
- Status - The status of each call, whether it was received or not.
- Call Duration - How long did that call last?
- Start Time - What time did the call start?
- End Time - What time did the call end?
- Call Type - Automatic tags for each call.
- Call Source - Where did the call originate from? For example, from the landing page.
Placements
This dashboard is located under the dropdown "More" and shows the placement of your Google Ads for the selected date range. Placements are where your Google Display Ads are showing up on the internet. You will see many of the same metrics with the addition of:
- Top Placements - Where are the top placements for your display ads appearing?
- Placements (table) - This table shows each display ad placement with the following metrics:
- View-Through Conversions
- Average CPC
- Clicks
- Conversion Rate %
- Conversions
- Cost
- Cost per Conversion
- Impressions
Videos
This dashboard is located under the dropdown "More" and shows Video metrics for the selected date range, for example if you are running ads on YouTube. You will see many of the same metrics in past dashboards including:
- Top Videos - This shows the top performing active videos you have running.
- Video Title (table) - This table shows the metrics for each video including:
- Video Title
- Video Duration
- Average CPC
- Impressions
- Cost per Conversion
- Cost
- Conversions
- Conversion Rate %
- Clicks
- View-Through Conversions
Your Strategy Coach can discuss any of these metrics with you!
Search Console Dashboard
In this dashboard you will see data from your Google Search Console account and can segment by Top Queries, Top Pages, Countries, Devices, and Sitemaps. Google Search Console provides search query keyword data that bring users to your site.

Top Queries
In this view you will see Search Console data for keywords used by people doing Google searches based on the selected date range. The metrics you will see are:
- Clicks (line chart) - How many clicks received each day for the searched keywords.
- Clicks (by query) - Clicks per search term used.
- Clicks (total) - Total number of clicks for all keyword queries in the selected date range.
- Impressions - Total number of impressions all keyword queries created.
- Average Position - The average search position for all keyword queries.
- CTR (Click-Through Rate) - Calculated as Clicks / Impressions * 100
- Keyword (table) - This table shows metrics for each search query with the following metrics:
- Keyword - What keyword did a searcher use to find your site?
- Clicks - How many clicks did that keyword bring in for the selected date range?
- Impressions - How many impressions did this keyword generate in the selected date range?
- Average Position - What is this keyword's average position in the search engine results page (SERP)?
- CTR % - What is the click-through rate for this keyword?
Top Pages
In this view you will see Search Console data for the top pages people doing Google searches landed on based on the selected date range. The metrics you will see are:
- Clicks (line graph) - The number of each page that received a click by date.
- Clicks (by page) - The number of each page's clicks.
- Clicks (total) - The total number of clicks all pages received during the selected date range.
- Impressions - The total number of impressions all pages received during the selected date range.
- Average Position - The average position of all the pages in the selected date range.
- CTR % - The click-through rate percentage for all the pages in the selected date range.
- Page (table) - This table shows metrics for all the top landing pages. The metrics include:
- Page - The URL of the page landed on.
- Clicks - The number of clicks the page received.
- Impressions - The number of impressions the page received.
- Average Position - The average position of the page.
- CTR - The click-through rate for that page.
Countries
In this view you will see Search Console data for the countries people doing Google searches live in based on the selected date range. The metrics you will see are:
- Clicks (line graph) - The number of clicks from all countries by day.
- Clicks (map chart) - Countries highlighted are where clicks are coming from.
- Clicks (total) - The total number of clicks from all countries.
- Impressions - The total number of impressions from all countries.
- Average Position - The average position your pages appear for all countries.
- CTR % - The click-through rate of your pages for all countries.
- Country (table) - This table shows each country with specific metrics for each country. You will see the following metrics:
- Country - Each country that has viewed pages on your website.
- Clicks - The number of clicks that comes from that country.
- Impressions - The number of impressions that comes from that country.
- Average Position - The average position your website shows up in that country.
- CTR % - The click-through rate for your website from that country.
Devices
In this view you will see Search Console data for the devices people doing Google searches use based on the selected date range. The metrics you will see are:
- Clicks (line graph) - The number of clicks from all devices by day.
- Clicks (pie/donut graph) - The number of clicks from each device.
- Clicks (total) - The total number of clicks from all devices.
- Impressions - The total number of impressions from all devices.
- Average Position - The average position your pages appear for all devices.
- CTR % - The click-through rate of your pages for all devices.
- Device (table) - This table shows each device with specific metrics for each. You will see the following metrics:
- Device - Did they use a desktop, tablet, or mobile device during their search.
- Clicks - How many clicks that specific device generated.
- Impressions - How many impressions that specific device generated.
- Average Position - The average position your pages appear on that device.
- CTR % - The click-through rate for that device.
Sitemaps
In this view you will see Search Console data for your website's sitemap. A sitemap is a file where you provide information about the pages, videos, and other files on your site, and the relationships between them. Search engines like Google read this file to crawl your site more efficiently. The metrics you will see are:
- Alerts Breakdown - This pie chart shows the total numbers of warnings, indexed (pages), pending (resolutions), and errors.
- URLs - Your sitemap URL and the number of pages it has listed. Tip: If you know you have more pages than listed, you might have an indexing problem!
- Warnings - The number of warnings Google Console has found using your Sitemap.
- Errors - The number of errors Google Console has found using your Sitemap.
- Pending - The number of pending validations Google Console has found using your Sitemap.
- Indexed - The number of pages that have been indexed with Google from your sitemap.
- Alerts - The number of alerts Google Console has found using your Sitemap.
- URLs - The number of indexed pages your sitemap has submitted.
- Path (table) - This table shows the URL (path) of your site map and the following metrics:
- Path - The URL of your sitemap.
- Type - The type of sitemap was submitted.
- Pending - Status of the sitemap, if it is pending indexing or not.
- Sitemaps Index - Whether or not the sitemap is the index for all sitemaps.
Your Strategy Coach can discuss any of these metrics with you!
Call Tracking Dashboard
In this dashboard you will see data from any call tracking that has been integrated.

This dashboard shows the following metrics:
- Answered vs Missed Calls - This pie chart shows the number of answered vs missed calls.
- Top Sources - What are the sources of the calls coming in? For example, Google My Business or Google Ads.
- Calls (line graph) - The number of calls per day.
- Calls (total) - The total number of calls for the selected date range.
- Answered - The number of calls answered for the selected date range.
- Missed - The number of calls missed for the selected date range.
- Calls (table) - This table shows specific metrics for each call based on the date of the call. The metrics in this table are:
- Date
- Name
- Source
- Phone Number
- Duration
- Location
- Answered
- Tags
Your Strategy Coach can discuss any of these metrics with you!
Citations Dashboard
BrightLocal (Citation Tracker)
This dashboard shows citation information for BrightLocal, a citation aggregator that pushed your company information out to directories across the internet. The citation tracker data is segmented into Key Citations, Live Citations, and Pending Citations.
Key Citations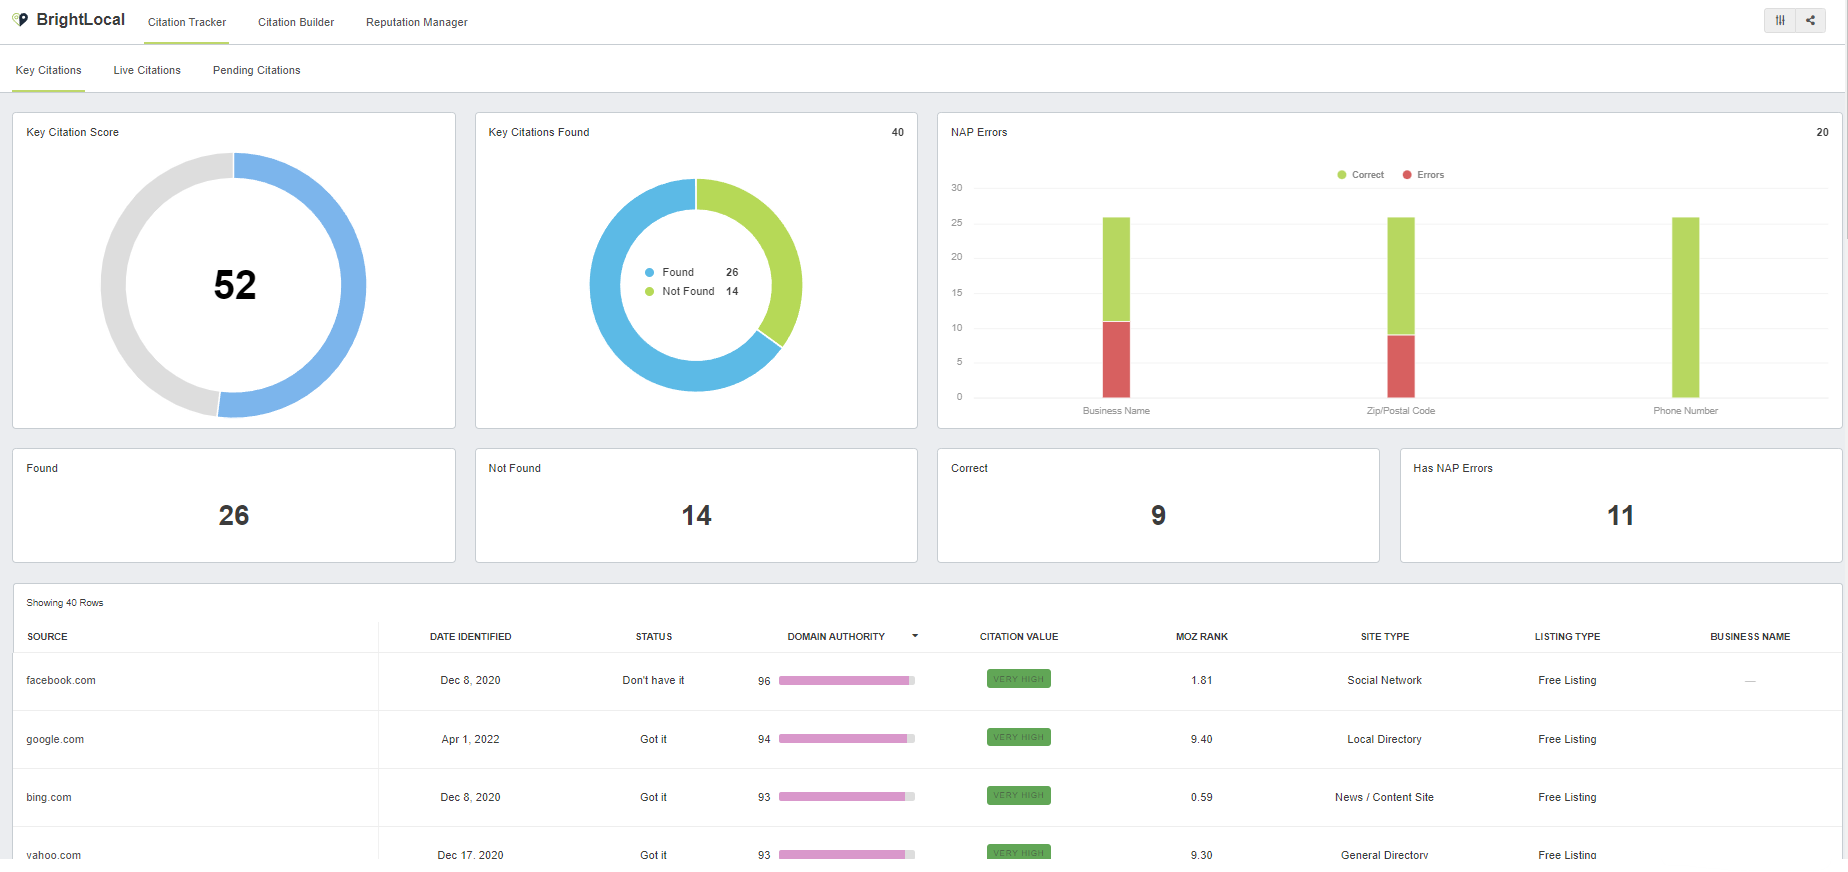
The Key Citations dashboard shows data for the top performing citations on the internet your data is pushed out to. You will see the following metrics:
- Key Citation Score - This is your overall citation score.
- Key Citations Found - The number of key citations found and not found.
- NAP Errors - The number of errors across the citations for your business name, phone number, and address.
- Found - The total number of citations found.
- Not Found - The total number of citations not found.
- Correct - The total number of citations that are correct.
- Has NAP Errors - The number of citations that have NAP (Name, Address, Phone) errors.
- Citation Source - This table shows specific metrics for each citation source, including:
- Source
- Date Identified
- Status
- Domain Authority
- Citation Value
- Moz Rank
- Site Type
- Listing Type
- Business Name (as it appears)
Live Citations
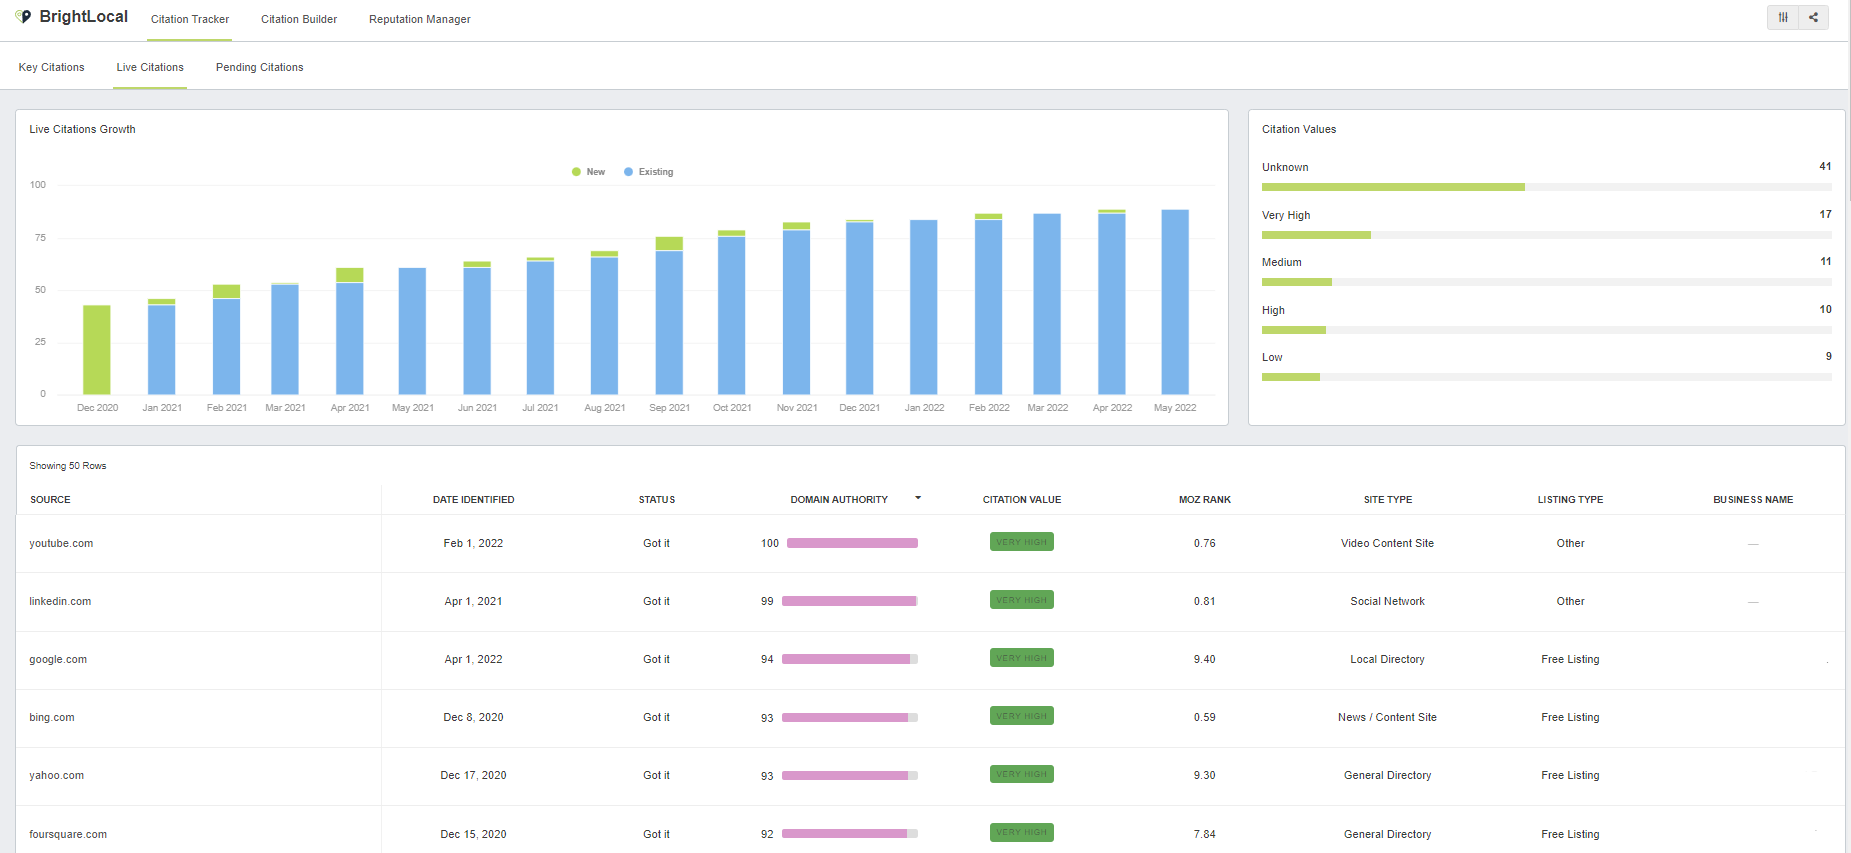
The Live Citations dashboard shows data for the live citations on the internet your data is published to. You will see the following metrics:
- Live Citation Growth - This bar graph shows each month's citation growth, showing new and existing citations.
- Citation Values - The number of citations by value; Very High, High, Medium, Low, and Unknown.
- Source - This table shows specific metrics for each live citation source, including:
- Source
- Date Identified
- Status
- Domain Authority
- Citation Value
- Moz Rank
- Site Type
- Listing Type
- Business Name (as it appears)
Pending Citations
This dashboard shows a list of pending citations. These are citations that are in the process of becoming live citations. You will see the following metrics:
- Source
- Data Identified
- Status
- Domain Authority
- Citation Value
- Moz Rank
- Site Type
- Listing Type
- Business Name (as it appears)
Your Strategy Coach can discuss any of these metrics with you!
Other Integrations Available & How to Connect to Them
There are many integrations available to include in your Reporting Dashboard! Our team is here to assist you with connecting to them if you are using them for your business.
Ads Integrations

- Google Ads
- AdRoll
- Amazon Ads
- Centro DSP
- Centro Basis
- Facebook Ads
- Google Display & Video 360
- Google Local Services Ads
- LinkedIn Ads
- Microsoft Ads (Bing Ads)
- Pinterest Ads
- Simpli.fi
- Snapchat Ads
- TikTok Ads
- Twitter Ads
- Yelp Ads
Analytics Integrations
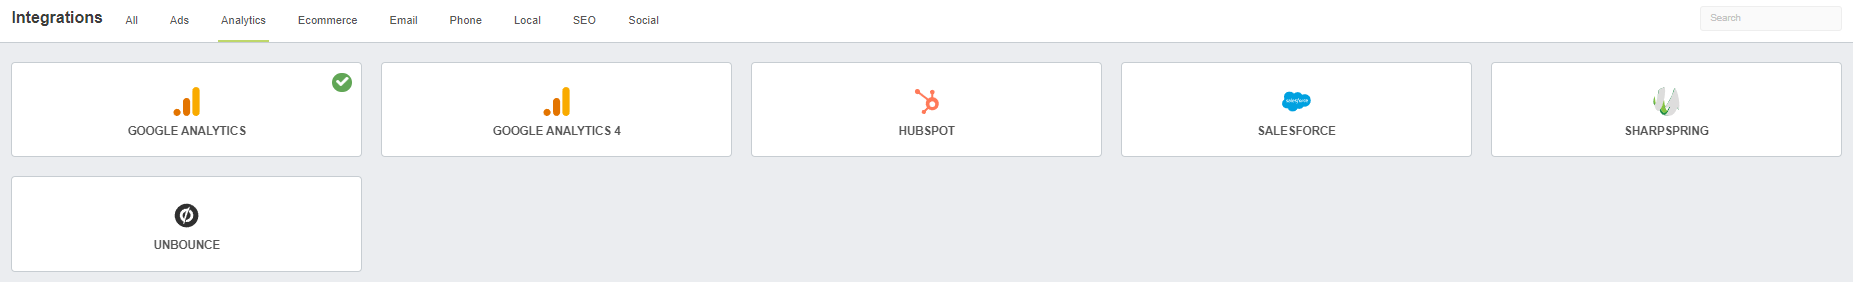
- Google Analytics
- Google Analytics 4
- HubSpot
- SalesForce
- SharpSpring
- Unbounce
Ecommerce Integrations

- Shopify
- WooCommerce
Email Integrations

- Active Campaign
- Campaign Monitor
- Constant Contact
- Klaviyo
- MailChimp
Phone Integrations
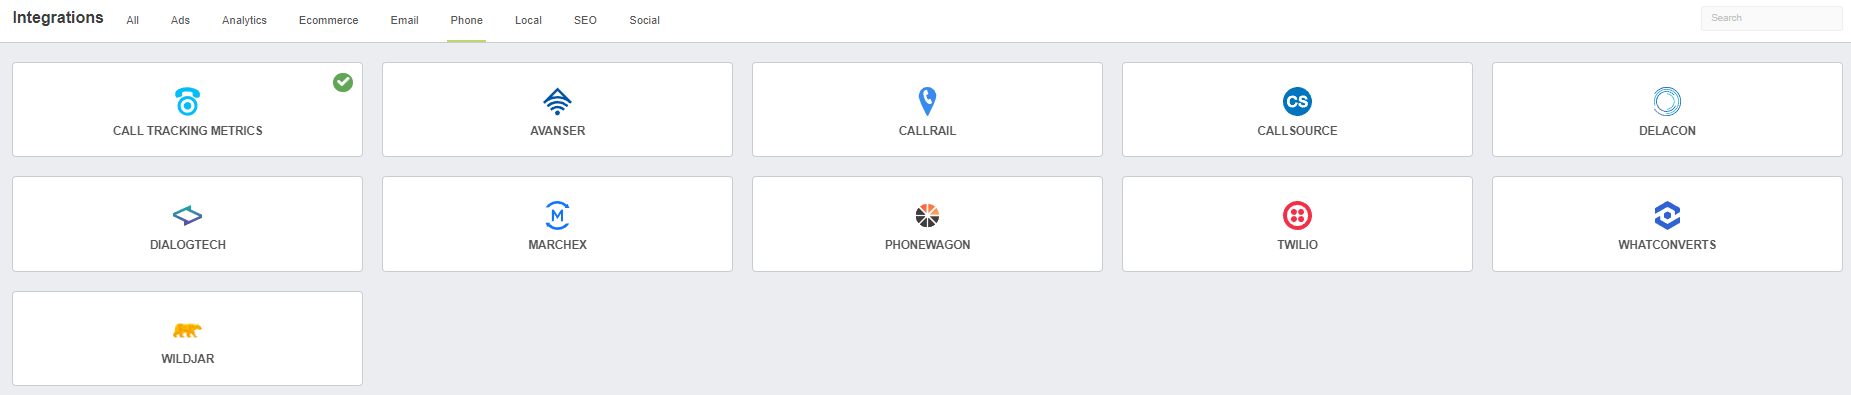
- Call Tracking Metrics
- Avanser
- CallRail
- CallSource
- Delacon
- Dialogtech
- Marchex
- PhoneWagon
- Twilio
- WhatConverts
- WildJar
Local Integrations
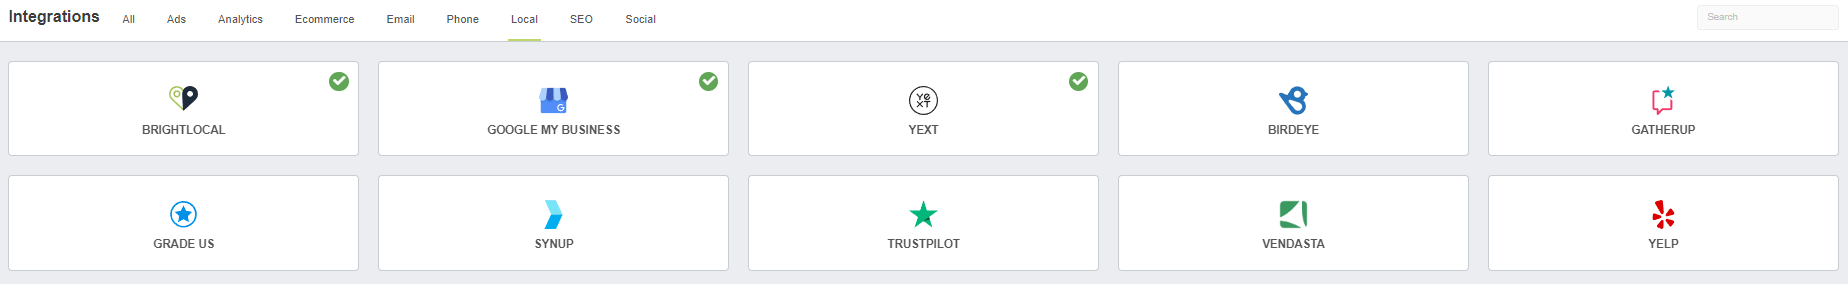
- BrightLocal
- Google My Business
- Yext
- Birdseye
- Gatherup
- Grade Us
- Synup
- TrustPilot
- Vendasta
- Yelp
SEO Integrations
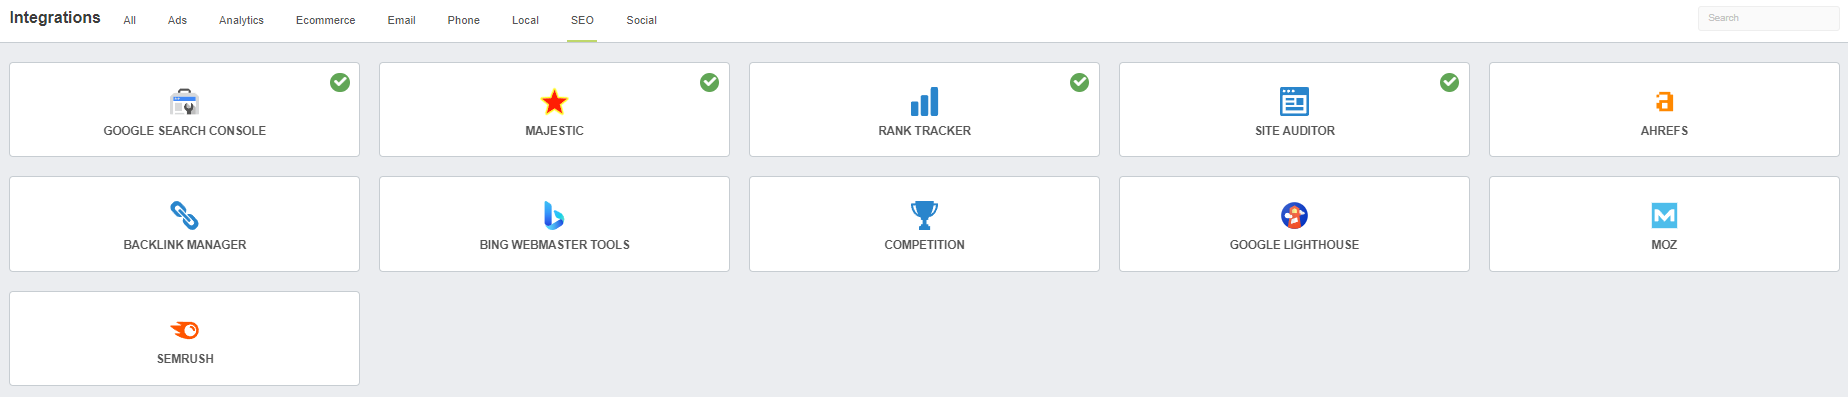
- Google Search Console
- Majestic
- Rank Tracker
- Site Auditor
- AHREFs
- Backlink Manager
- Bing Webmaster Tools
- Competition
- Google Lighthouse
- Moz
- SEMRush
Social Integrations
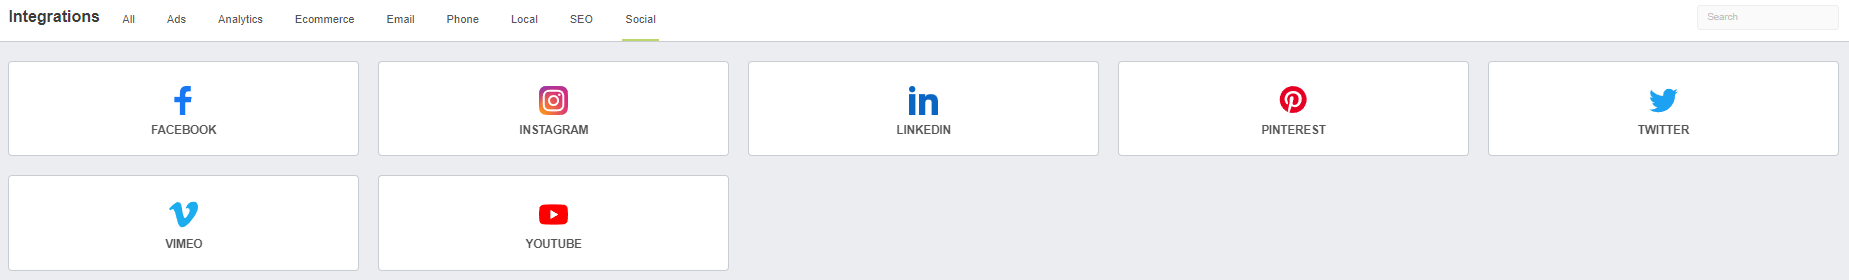
- Instagram (AKA The 'Gram)
- Vimeo
- YouTube
Need assistance connecting an integration? Contact James for assistance at support@industrial.marketing for help!
There's a lot of information available in all these dashboards, so don't hesitate to reach out to your Strategy Coach to learn more!
![]()